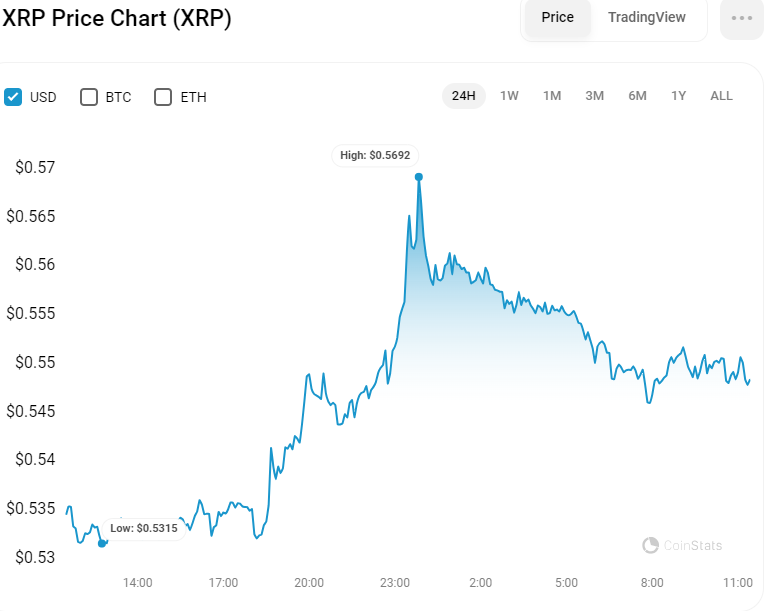
- Ripple’s XRP token rises 10.54% over the week, market cap hits $30.220 billion.
- Analysts predict XRP could reach $1.4, citing a completed double bottom pattern.
- XRP faces resistance at 50% Fibonacci level, bullish MACD and RSI indicators.
Over the past week, Ripple’s XRP token has shown a strong uptrend, with its value rising by 10.54%. This positive movement has persisted, with an additional 3.04% gain in the past day, elevating XRP’s

Moreover, trading volume has significantly increased by 43.97% over the last day, hitting $1.6 billion. This heightened trading activity indicates a growing belief among investors and traders in XRP’s prospects for further appreciation, buoyed by the current favorable market sentiment.
Analysts Focus on XRP’s Potential Climb to $1.4 Amidst Technical Shifts
EGRAG CRYPTO, a notable cryptocurrency analysis commentator, has updated the technical patterns shaping Ripple’s XRP token. The analysis points to a shift in market dynamics, transforming what was once seen as a consolidation area into a supply zone. Additionally, a region previously characterized by price wicks is now deemed a demand and accumulation zone.
At the heart of this positive forecast is the spotting of a double bottom pattern on the XRP chart. This pattern, widely regarded as a strong bullish signal, has been completed, as per the analyst, who predicts a likely uptrend for XRP.
The double bottom, identified by two distinct lows at approximately the same level, often precedes a price increase, indicating that a rise in XRP’s value may be on the horizon. EGRAG CRYPTO’s tweet suggests that XRP’s price could potentially hit the $1.4 mark.
XRP/USD Pair Price Analysis
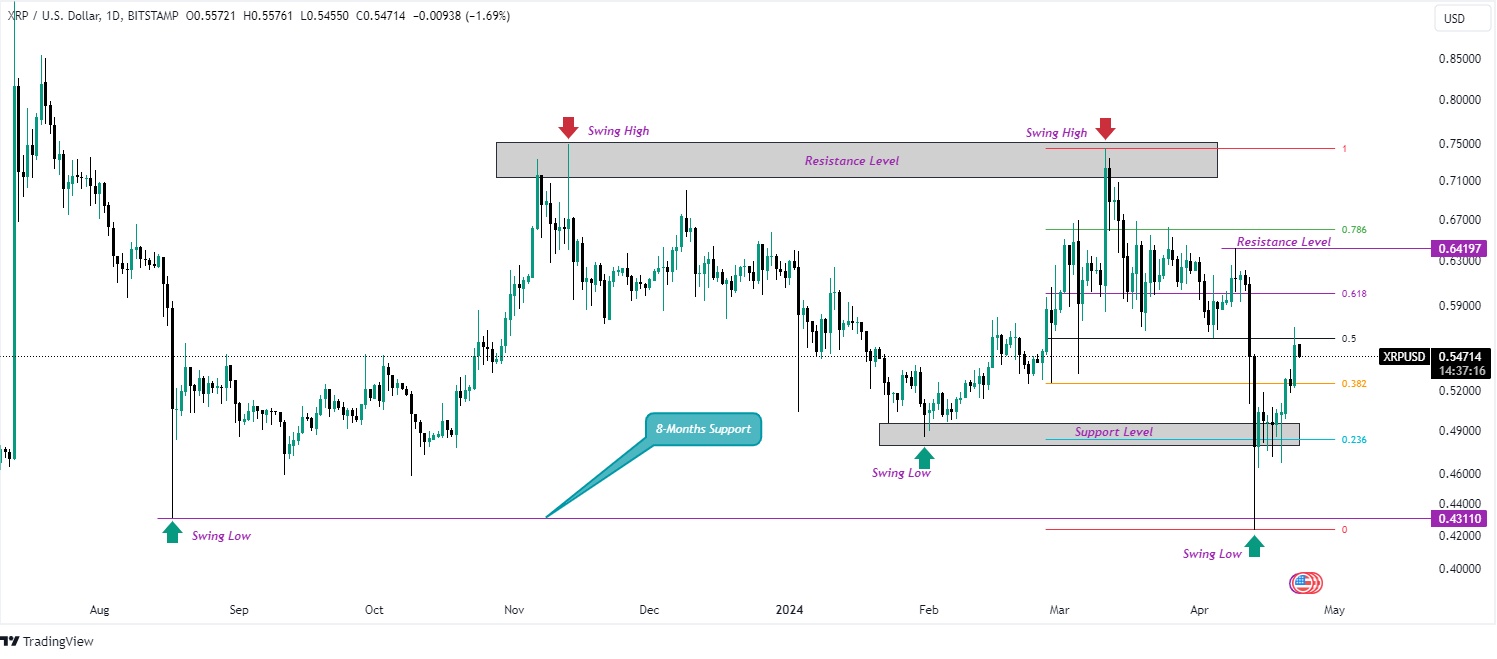
The one-day chart shows XRP’s price action aiming for the 61.8% Fibonacci retracement level, facing resistance above it. Currently, the price is experiencing some resistance near the 50% Fibonacci level. If XRP can surpass this level, it may approach the significant resistance point at $0.6419.
On the other hand, if XRP cannot overcome the 50% Fibonacci level, it might see a pullback towards the support level at $0.5278, allowing traders to reevaluate their positions ahead of the next possible price movement.

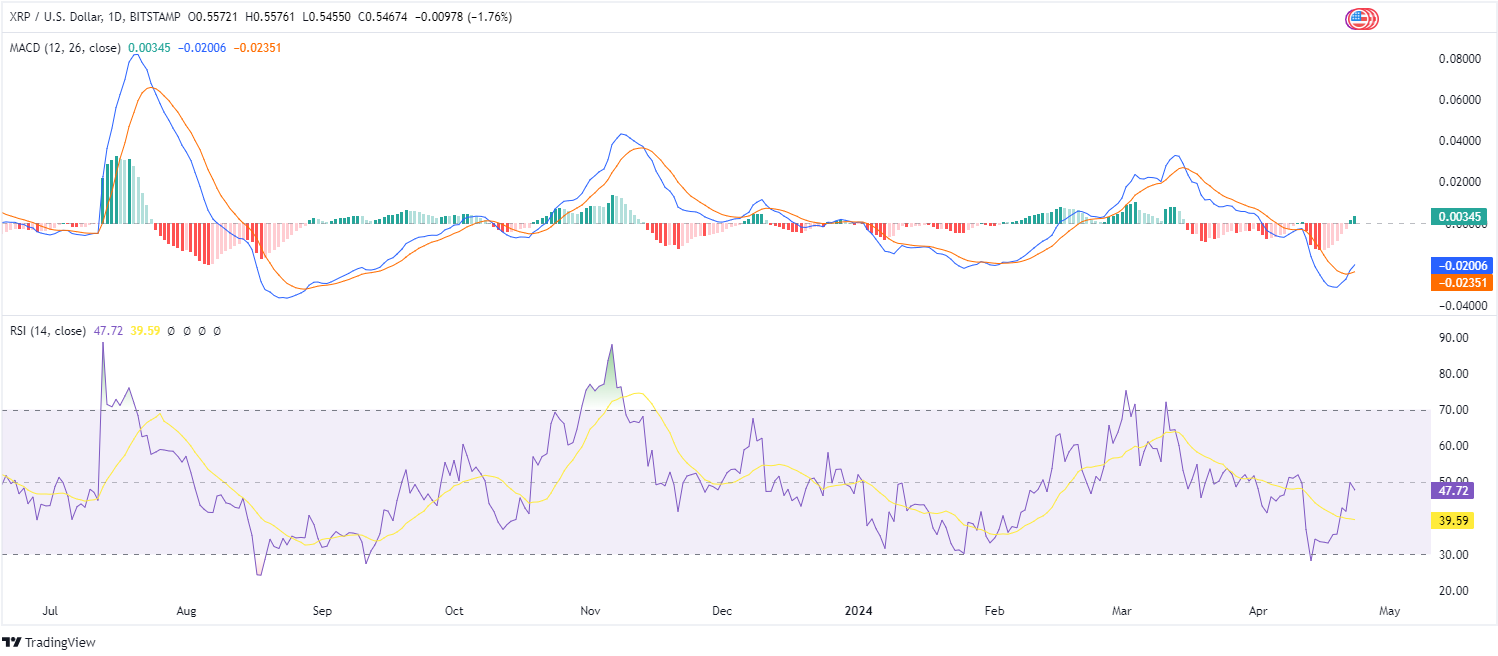
The MACD indicator on the technical charts is signaling an uptrend after a bullish crossover with the signal line in the negative territory, suggesting short-term bullish momentum. The MACD line at 0.020 points to a growing bullish sentiment, further supported by the increasing size of the histogram bars, indicating a strengthening upward trend.

Likewise, the RSI is leaning towards a bullish stance, positioned above the signal line at 47.72. Although it is near the neutral zone, this implies a short-term neutral state for XRP. Nonetheless, it also implies the possibility of sustained bullish momentum for XRP in the approaching period.
Disclaimer: The insights, perspectives, and data presented in this price analysis are published in good faith. Readers must conduct their own research due diligence. Any decision made by the reader is solely their responsibility, and Crypto Outlooks shall not be held responsible for any consequential or incidental harm or loss.


