- XRP trading volume spikes 240.21% to $1.84 billion in 24 hours.
- SEC faces a deadline to address Ripple’s proposed remedies in a legal dispute.
- XRP’s price faces resistance; technical indicators suggest a potential downward correction.
During an extraordinary period of 24 hours, the trading volume of XRP

The current market instability is directly linked to the ongoing legal battle between Ripple, the company associated with XRP, and the U.S. Securities and Exchange Commission (SEC). Today, the SEC has a significant deadline to respond to Ripple’s suggested remedies in their continuing legal conflict.
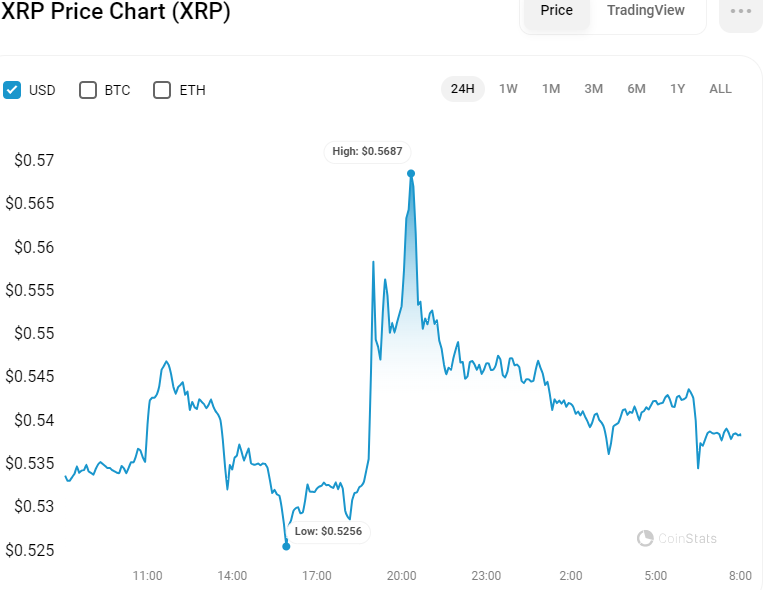
According to the latest report, the cost of each XRP token is currently $0.5383 as the market processes these events. Even with the price changes, XRP’s overall market value holds steady, showing a slight increase of 0.78% within the day, reaching a total of $29.7 billion.
The ratio of trading volume to market capitalization for XRP stands at 6.19%, reflecting a high level of trading activity in relation to the market cap of XRP. This ratio is an important measure of investor sentiment, indicating that the heightened trading activity is consistent with trends seen during previous times of market instability.
XRP Encounters Significant Technical Hurdles
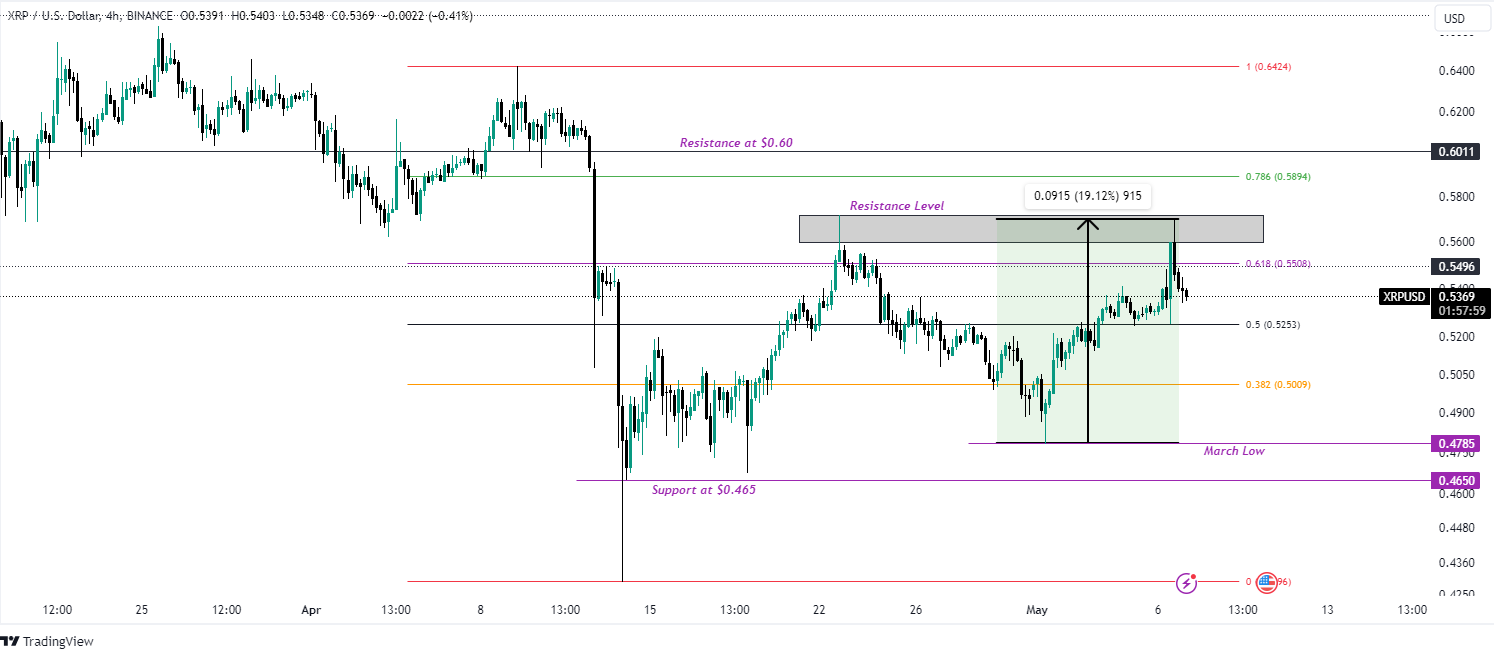
On the 4-hour chart, the XRP token has displayed a bullish trend since the start of the month, with a 19.12% increase. Nonetheless, after encountering resistance around the $0.57 mark, the token began to correct in price, seeking to retest the 50% Fibonacci retracement level to find a new support base.

Should the current level demonstrate durability, XRP’s value may initiate a fresh upward movement, potentially exceeding the resistance zone at $0.57. If this resistance is overcome, it could pave the way for XRP to aim for the $0.60 resistance mark.
On the flip side, should the 50% Fibonacci retracement level be compromised, XRP’s valuation could decline to seek support at the 38.2% Fibonacci retracement level, which acts as a lower-tier defensive line. A violation here could lead to a descent in XRP’s value to the lows seen in March, signifying a notable retracement.
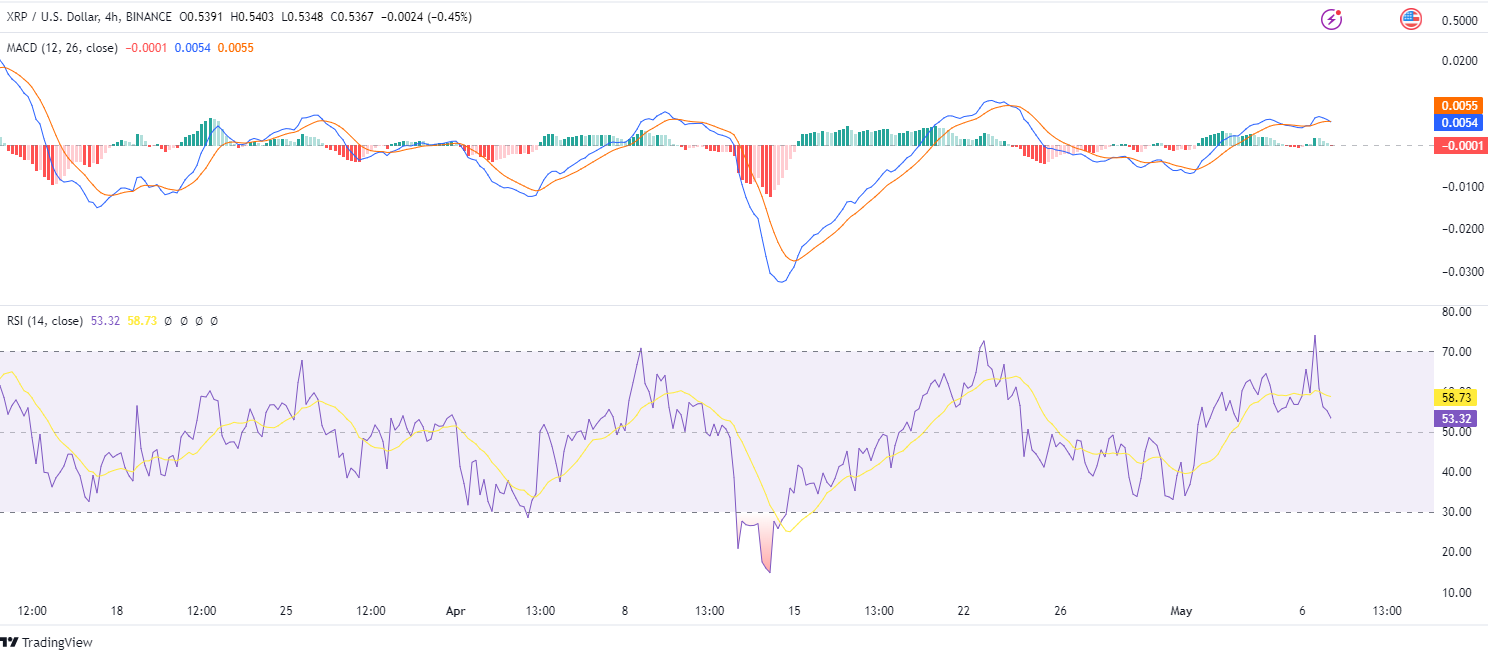
From a technical perspective, the Moving Average Convergence Divergence (MACD) indicator is on a downward trajectory, currently at 0.0054, indicating a diminishing bullish trend. This suggests a potential shift in the market where the bears may begin to dominate in the near term.

Moreover, the MACD line has slightly moved below the signal line, indicating a potential decline. The decreasing MACD histogram bars, reflecting the current market mood, are approaching the zero line, indicating a reduction in buying activity and a possible shift to increased selling.
Consistent with these indicators, the Relative Strength Index (RSI) has moved out of the overbought territory, trending downwards in a corrective fashion and hinting at an upcoming price adjustment period. With its current value at 53.32 and beneath the signal line, the RSI points to a possible downward trend as it nears the neutral zone and persists in its downward trajectory.
Disclaimer: The insights, perspectives, and data presented in this price analysis are published in good faith. Readers must conduct their own research due diligence. Any decision made by the reader is solely their responsibility, and Crypto Outlooks shall not be held responsible for any consequential or incidental harm or loss.


