- Cryptocurrency community awaits Fed Meeting outcome for digital asset future.
- ETH’s price struggles to maintain stability at $1,848 support level.
- SOL shows potential for bullish trend, but sellers may capitalize on profits.
The cryptocurrency community is eagerly awaiting the outcome of the Fed Meeting to gauge the future of the digital asset. Within the vast array of cryptocurrencies, seasoned investors and enthusiasts are particularly focused on monitoring the performance of the prominent contenders in the market, namely ETH and SOL. It is imperative to delve deeper into the historical price sentiments of these alternative coins to gain a comprehensive understanding of their trajectory.
Ethereum’s Price Analysis
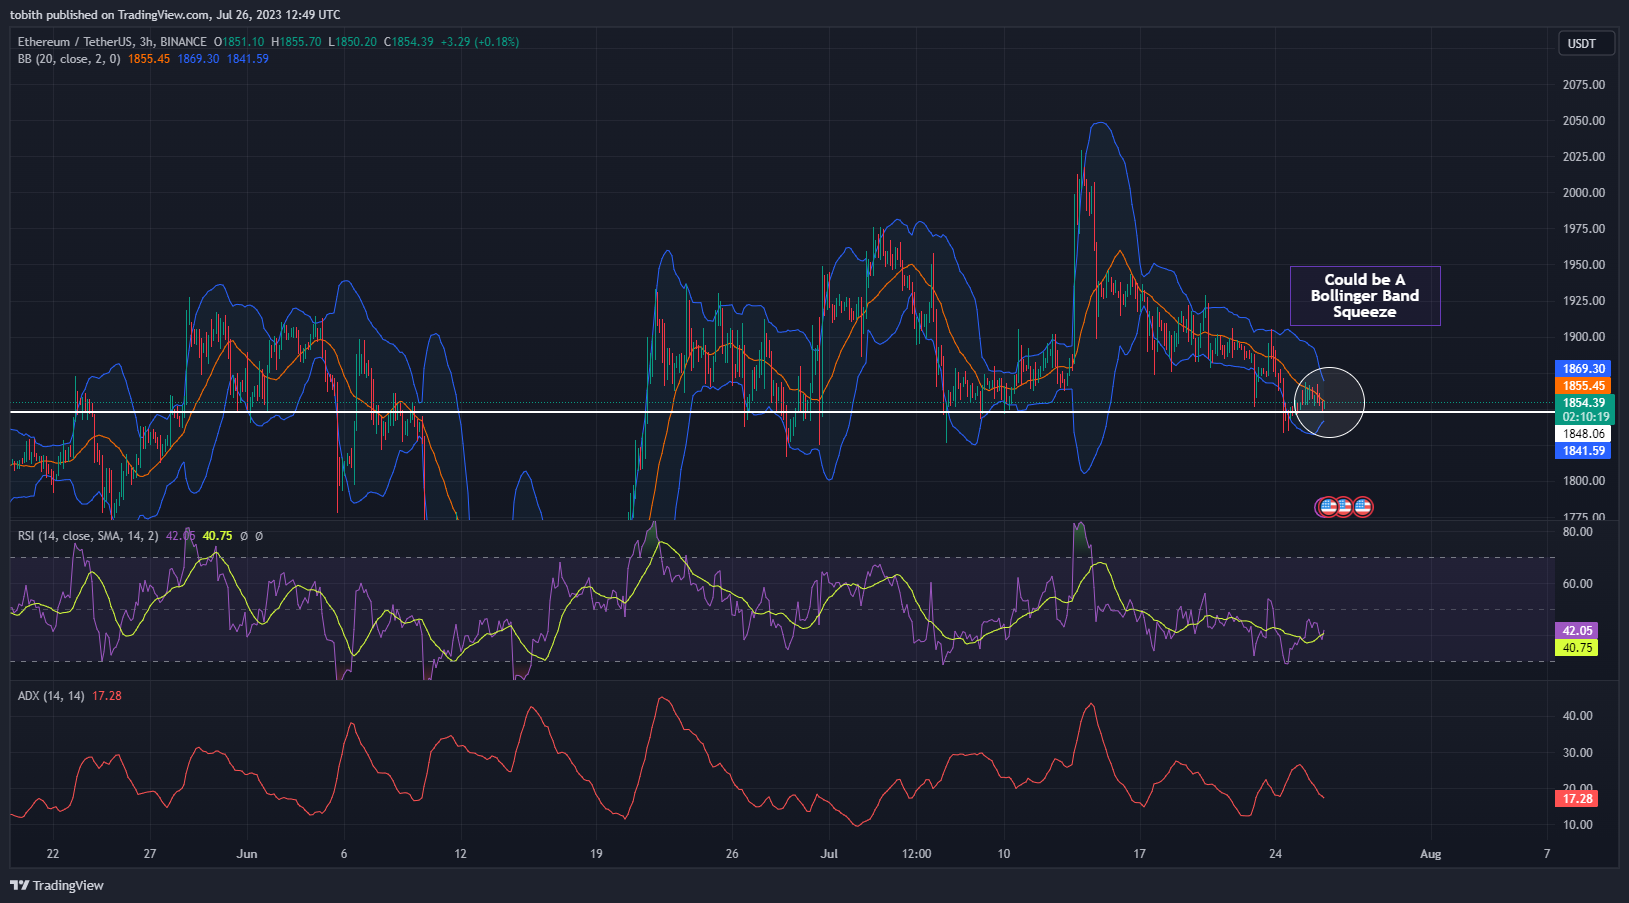
Upon analyzing the 3-hour chart of ETH/USDT, it is observed that the current trading price of the candlesticks stands at $1,855, slightly below the middle line of the Bollinger Bands. During the middle of June, ETH, alongside other altcoins, witnessed a substantial surge in their market values. This significant upswing presented ETH with a favorable prospect of surpassing the $2,000 threshold.
Nevertheless, Ethereum’s brief sojourn at the $2,000 mark was abruptly interrupted by a forceful onslaught orchestrated by bearish market participants. This unexpected assault gradually eroded the value of ETH, leaving the altcoin grappling to maintain stability at the $1,848 support level.

Nevertheless, two notable indicators suggest a potential recovery for ETH in the coming days. Firstly, the Bollinger bands exhibit signs of contraction, indicating an imminent breakout. This Bollinger Band squeeze holds significant importance for traders, as it can provide insights into the direction of the impending breakout, whether it will be an upward or downward movement.
In the crypto industry, the RSI is currently showing an upward movement, indicating the entry of buyers into the market. This influx of buyers could lead to an upward trajectory for ETH. However, it is important to consider the ADX, which currently stands at 17.28, suggesting a weak trend strength. The recent sudden decline may have influenced this weakness observed in the market.
Solana’s Price Analysis
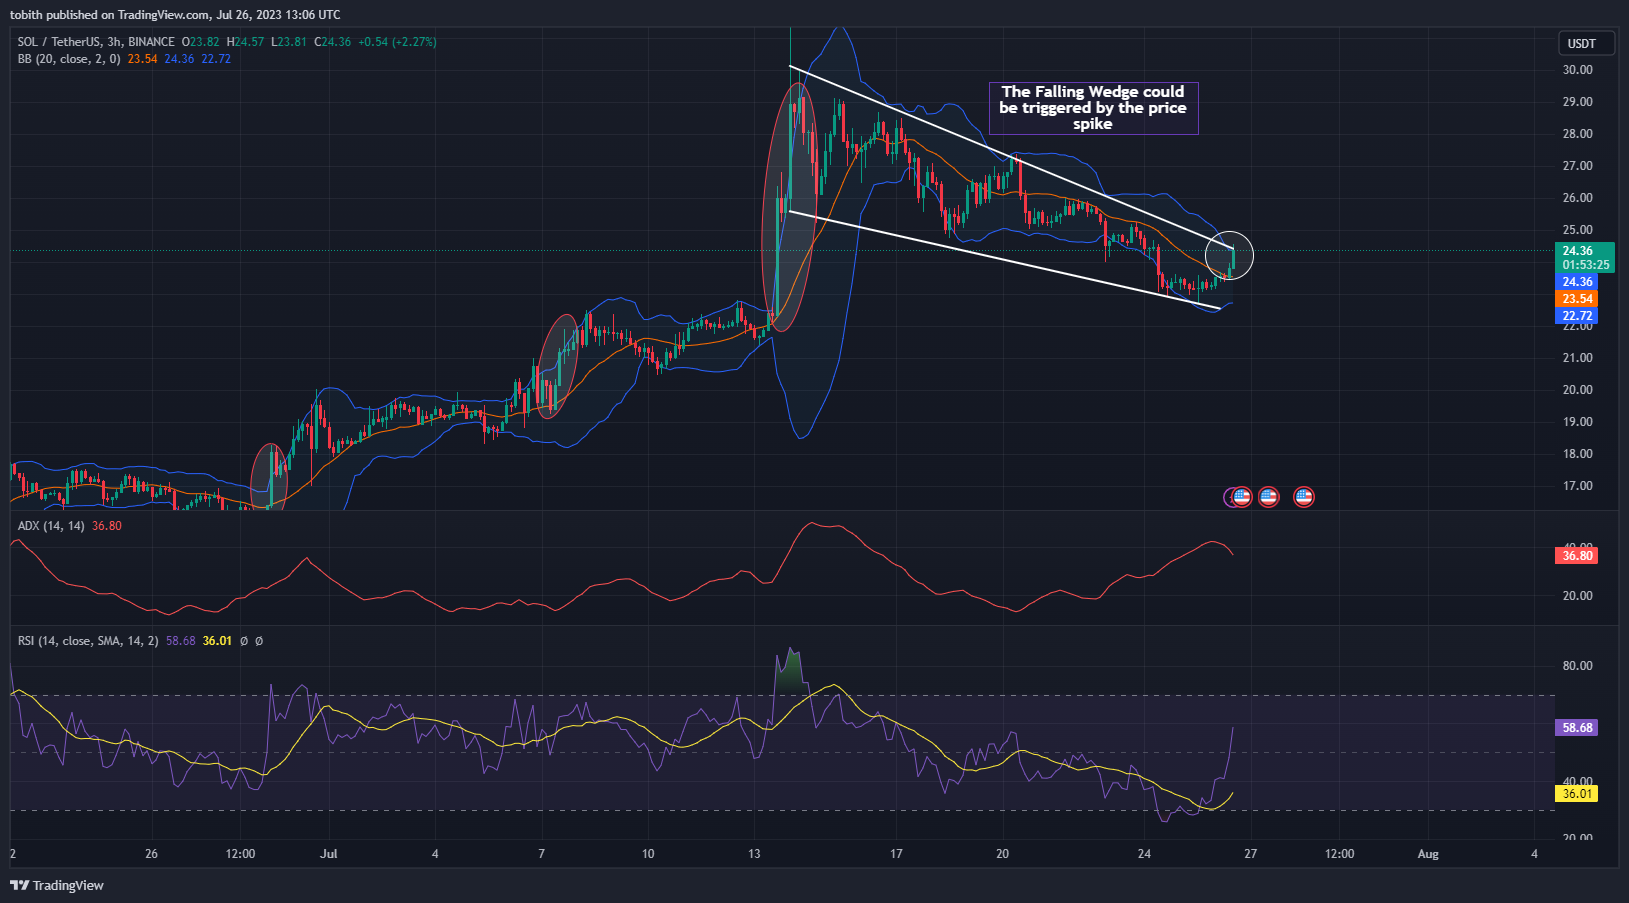
Solana’s native token appears to have initiated a bullish trend ahead of schedule, although additional confirmation is required by establishing higher highs. Analyzing SOL’s 3-hour chart, it is evident that the candlestick patterns are currently forming a descending wedge pattern, indicating the potential for an imminent breakout and subsequent uptrend. The emergence of green candlesticks suggests that SOL is endeavoring to enter the bullish market.

Traders should be aware that the abrupt price surge may present a favorable chance for sellers aiming to capitalize on profits, potentially resulting in a decline in SOL. The RSI indicates a significant influx of buyers into the market, with a value of 60.75. Additionally, the ADX confirms the robustness of the ongoing trend, registering a value of 36.95. However, the ADX is also displaying a downward trend, which could indicate a potential weakening of the trend’s strength in the future.
Conclusion
SOL has exhibited a promising commencement in this ongoing bullish market, although there is a potential risk of a subsequent decline due to its rapid price escalation. Conversely, ETH is yet to enter the bullish market and establish a substantial influence on its user base.
Disclaimer: The insights, perspectives, and data presented in this price analysis are published in good faith. Readers must conduct their own research due diligence. Any decision made by the reader is solely their responsibility, and Crypto Outlooks shall not be held responsible for any consequential or incidental harm or loss.


