- Solana (SOL) experienced a remarkable recovery, reaching $17.48 in less than a week.
- SOL emerged as the second most lucrative cryptocurrency, surpassing Bitcoin and Ethereum.
- The Relative Strength Index (RSI) suggests SOL’s bullish momentum is likely to persist.
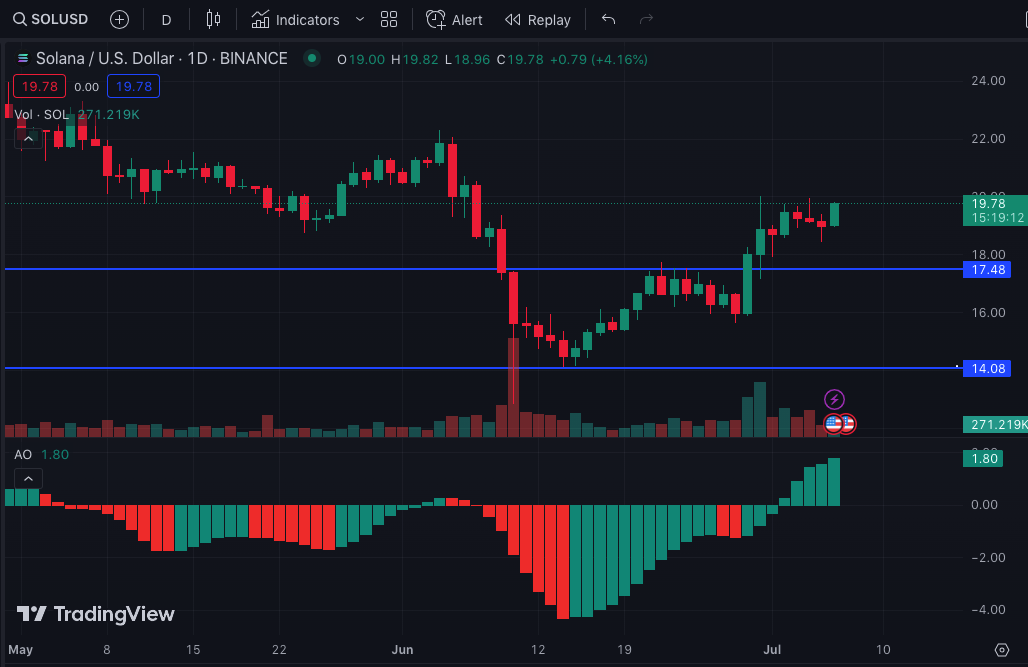
In June, Solana (SOL) experienced a series of significant downward movements, indicated by six consecutive red candles on the daily chart. Despite continuous efforts, the token struggled to counter the bearish sentiment prevailing in the market. Nevertheless, a strong buying force emerged at the $14.08 level, managing to salvage the remaining value of the decline. This led to a remarkable recovery, with bullish investors driving the price to $17.48 within less than a week.
As a result, SOL emerged as the second most lucrative cryptocurrency among the top ten in the past week, surpassing the performance of Bitcoin (BTC) and Ethereum (ETH). It trailed behind Litecoin (LTC), set to undergo a halving event.
Bears have lost their dominance
Currently, bears may encounter difficulties in overpowering bulls. Despite occasional minor sell-offs during SOL’s ascent to $19.66, the Awesome Oscillator (AO) reinforces a positive outlook for bullish market sentiment.
The AO stands at 1.79, following a conspicuous endeavor to establish a bullish twin peak. By employing the disparity between the 34 and 5-period Simple Moving Average (SMA), the fundamental analysis of the data above implies the potential existence of an upward trend.

Furthermore, the successive upward trends depicted by the prominent green bars indicate that the present SOL price may present an opportune moment for accumulation, particularly for those intending to hold their investments for the medium term.
Northward lies the potential next path
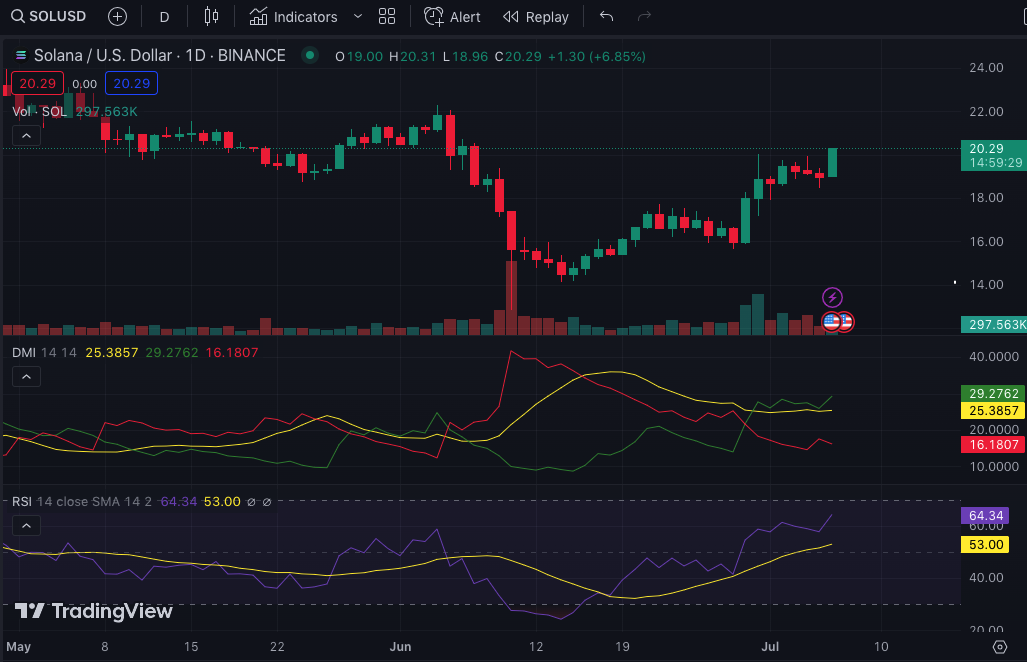
The Directional Movement Index (DMI) agreed with the signals provided by the AO indicator. The +DMI (green) on the daily chart stood at 29.27, indicating a positive trend. Conversely, the -DMI (red) was at 16.18 and showed a downward movement.
Despite the apparent stabilization of the +DMI at the point above, it is important to note that buyers continued to dominate the market. This observation is further reinforced by the concurrent presence of the Average Directional Index (ADX), which lends additional support to the indicator above.
The ADX (yellow) stands at 25.38, indicating that the +DMI directional strength surpasses the -DMI. This suggests a favorable scenario for bulls, which can sustain their momentum unless confronted with significant selling pressure.
Moreover, the Relative Strength Index (RSI) suggests that SOL’s bullish momentum is likely to persist, as indicated by a reading of 64.21. This signifies a strong demand for SOL and an influx of buy orders. However, if the RSI surpasses the 70 mark, it could trigger profit-taking activities and potentially slow SOL’s upward trend.

In summary, SOL’s price could experience a modest decline in light of its recent gains. Nevertheless, there remains a possibility for the token to further capitalize on its upward trajectory in the upcoming days, as a significant depreciation appears improbable.
Disclaimer: The insights, perspectives, and data presented in this price analysis are published in good faith. Readers must conduct their own research due diligence. Any decision made by the reader is solely their responsibility, and Crypto Outlooks shall not be held responsible for any consequential or incidental harm or loss.


