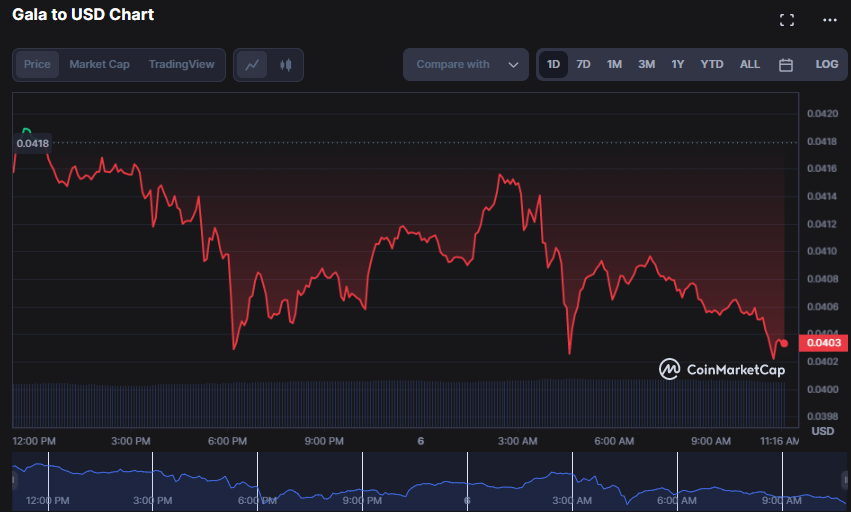
The current state of the Gala (GALA) market has been marked by a bearish trend, as attempts to revive the market with bullish efforts were met with resistance at the 24-hour high of $0.0419. Unfortunately, these efforts proved futile, as the bears took control and pushed the price down to a 24-hour low of $0.04021.
The value of GALA stands at $0.04034, marking a 3.19% decline from its previous closing. In the event of a bullish rebound and a successful breach of the $0.0419 resistance, the next level to keep an eye on would be $0.0445. Conversely, if the bears maintain their hold on the market, GALA could potentially plummet to $0.038.
Despite the downturn, the market capitalization of GALA experienced a 3.00% decline, settling at $281,366,128. However, there is a silver lining as the 24-hour trading volume increased by 3.29% to $126,415,528. This indicates that there is still significant interest in GALA, and traders are actively taking advantage of the dip. The data suggests that the market remains dynamic and resilient, with traders displaying a keen sense of market awareness.

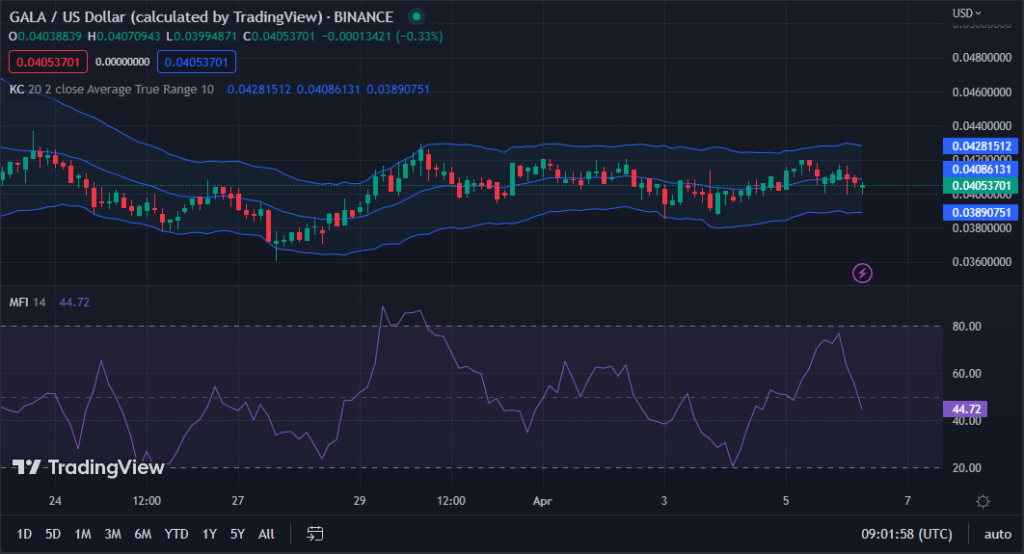
According to the 3-hour price chart of GALA, the Keltner Channel bands are exhibiting a downward trend. The upper bar is currently at 0.04278842, while the lower is at 0.03888144. This movement suggests that the bearish momentum of GALA is gaining strength, and traders may want to consider selling or shorting the asset to capitalize on the downward trend.
Based on the current price action, the bears appear to dominate the market. The formation of red candlesticks and the drop below the middle line at 0.04083525 suggest that the price will likely continue its downward trend. As such, short-term traders may want to keep a close eye on the next support level at 0.0375, which could serve as a viable target for potential gains. It’s important to remain vigilant and monitor the market closely, as the bears seem to be in control for now.
The Money Flow Index is currently on a downward trend, clocking in at 44.74, reinforcing the negative momentum in GALA. This suggests that the selling pressure is gaining momentum. If the MFI continues to plummet and dips below the oversold level of 30, it could signal a more significant negative trend shortly. As such, traders should exercise caution when contemplating long positions.

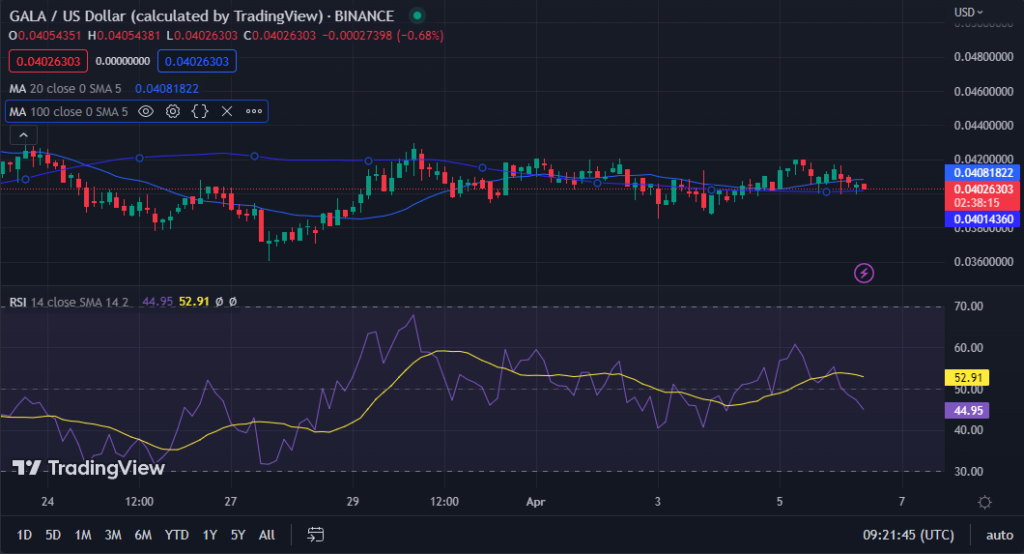
According to the 3-hour price chart for GALA, the 20-day moving average (MA) currently stands at 0.04081822, while the 100-day MA is at 0.04014360. The crossing of the shorter-term MA above the longer-term MA suggests a shift towards a bullish trend for GALA, as the negative momentum is losing steam. These technical indicators indicate a possible reversal shortly, making GALA an asset to watch closely.
As the 20-day moving average (MA) has surpassed the price action, GALA may explore the 20-day MA while simultaneously bouncing off the 100-day MA. This presents a promising entry opportunity for traders. However, it’s important to note that the 100-day MA remains below the price action, indicating a potential long-term negative trend. As such, traders should remain vigilant for potential resistance levels that could impede a positive breakout.
The Relative Strength Index (RSI) currently stands at 44.95, signaling a potential downturn for GALA in the short term. As the RSI dips below its signal line and enters the oversold territory, traders may want to exercise caution before taking a long position. It may be wise to wait for the RSI to climb out of oversold conditions and cross above its signal line before making any moves. Staying vigilant and patient can help traders make informed decisions and confidently navigate the market.

The bearish trend of GALA persists, but there is a glimmer of hope for a bullish reversal. Traders are advised to exercise prudence and closely monitor crucial support and resistance levels before making any moves.
Disclaimer: The insights, perspectives, and data presented in this price analysis are published in good faith. Readers must conduct their own research due diligence. Any decision made by the reader is solely their responsibility, and Crypto Outlooks shall not be held responsible for any consequential or incidental harm or loss.


