- Ripple (XRP) price falls to $0.55, losing 10.54% since year start.
- Bearish signals from MACD and Aroon indicators suggest further XRP decline.
- XRP’s RSI drops, Supertrend indicator signals sell, hindering immediate price recovery.
The price of Ripple
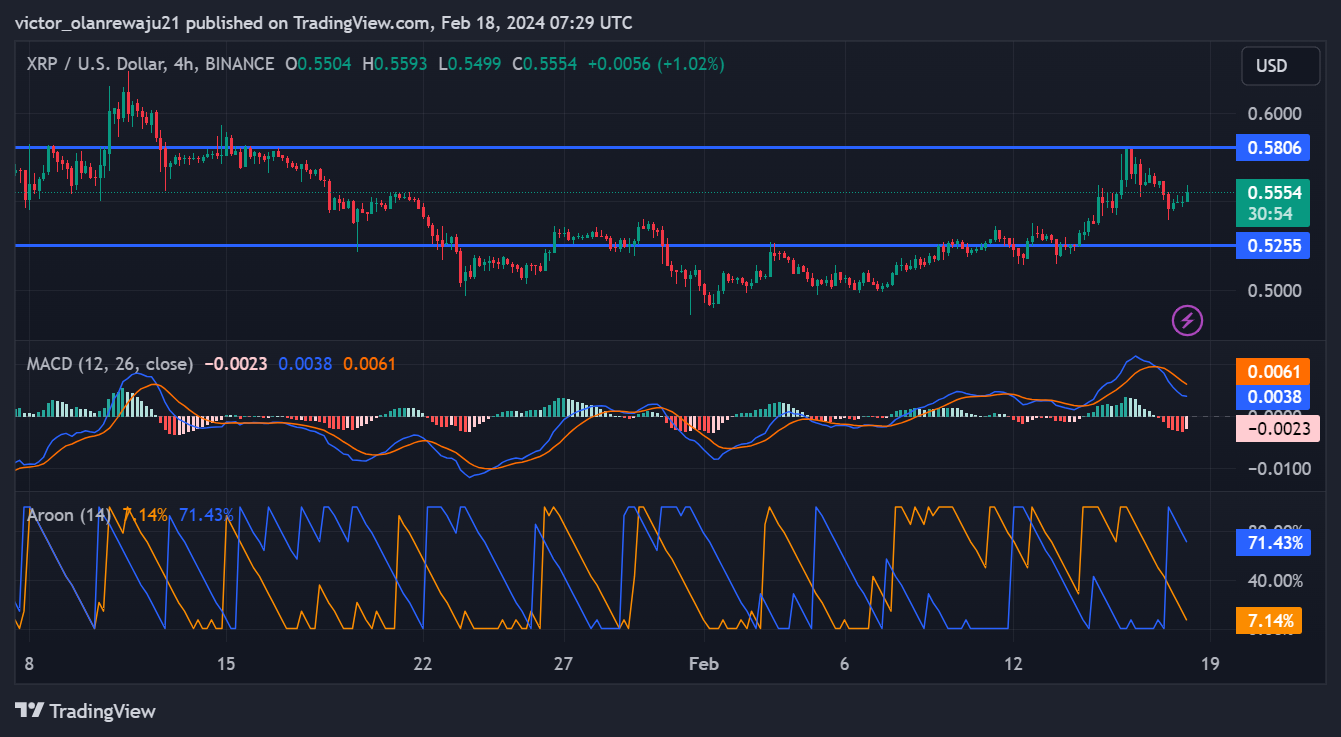
The short-term upward trend towards $0.60 on the 4-hour chart for XRP against the US dollar may not occur. This forecast can be attributed to the obstacle presented by the $0.58 resistance level.
XRP/USD 4-Hour Analysis
Bulls made efforts to elevate the price of XRP, yet the bears took over, demonstrating that the bulls no longer dominated the market. Should a significant bullish force emerge, XRP could potentially reach $0.58. However, achieving this level would necessitate a surge in purchasing activity, which is presently absent for the token.
In the event of a significantly negative market trend, XRP could experience a decline. Should such a scenario occur, its value could retract to the $0.52 mark. Successfully maintaining the support at $0.52 could lead to a recovery. Conversely, if the price falls below $0.50 due to the bulls’ inability to sustain it, XRP may then drop to approximately $0.48.
The Moving Average Convergence Divergence (MACD) signals showed a growing bearish trend. Initially, the extended EMA (colored orange) crossed over the brief EMA (colored blue). In addition, the value of the MACD was negative, specifically at -0.0023.
If there is an absence of purchasing momentum, it is possible that the price of XRP could experience a decline greater than what has been observed recently. In addition to the Moving Average Convergence Divergence (MACD), the Aroon indicator also indicates a potential uptrend. Currently, the Aroon Up line (in orange) is 7.14%, and the Aroon Down line (in blue) is 71.43%.

The difference suggests that there was a significantly greater bearish influence compared to bullish in the market. Should this trend persist throughout the upcoming week, it is unlikely that XRP will surpass the resistance level at $0.58. Nonetheless, the token appears poised for consolidation, potentially maintaining a price range of $0.53 to $0.56 over the short term.
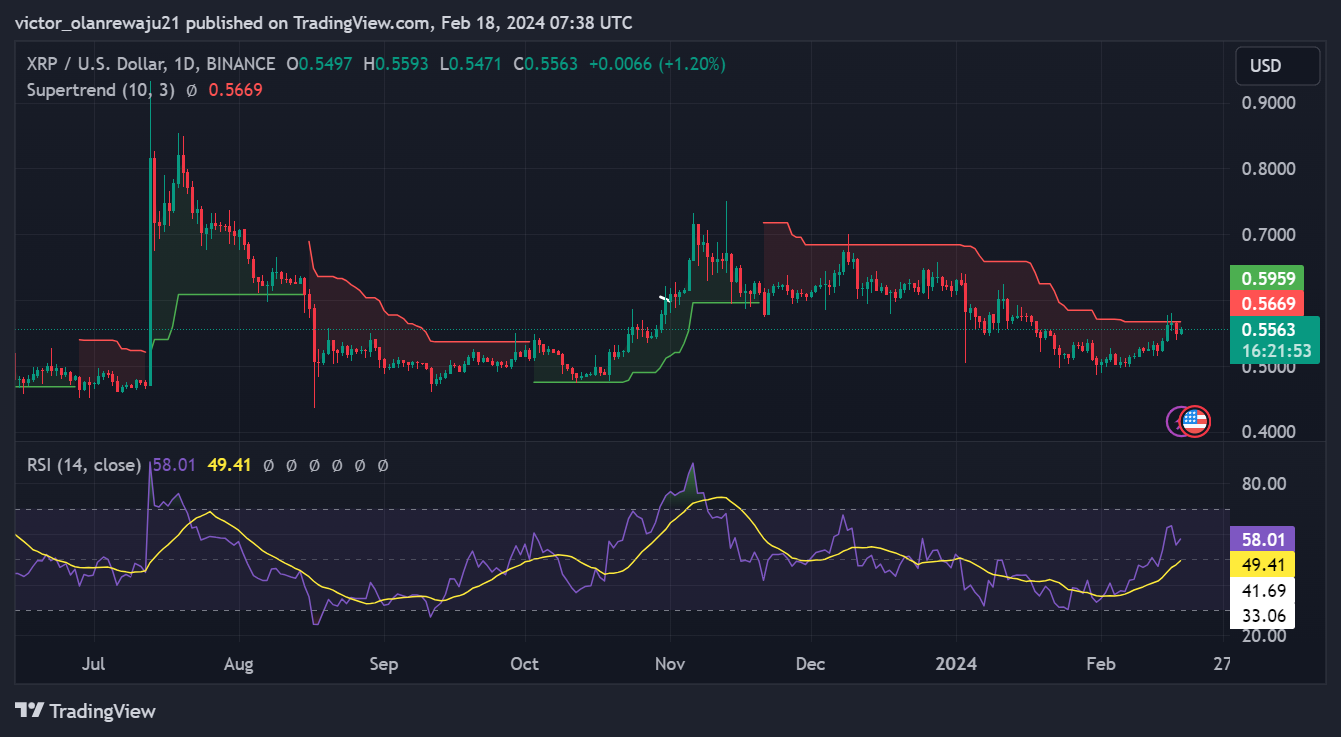
XRP/USD Daily Analysis
In the daily chart, the Relative Strength Index (RSI) stood at 58.01, representing a drop from the previous level recorded on February 15. At that time, the RSI had reached 63.53, coinciding with the XRP price rise to $0.57.
Consequently, the diminishing momentum indicated that an upward trend shortly seemed improbable. Coin Edition took into account the Supertrend indicators. As of the latest update, the Supertrend’s red zone was positioned over the price of XRP, signifying a signal to sell.

It appears challenging for XRP to recover its upward trend in the coming week. However, a shift in the overall market mood could assist XRP in making a comeback. A drop beneath the $0.55 mark appears to be the probable course for the cryptocurrency.
Disclaimer: The insights, perspectives, and data presented in this price analysis are published in good faith. Readers must conduct their own research due diligence. Any decision made by the reader is solely their responsibility, and Crypto Outlooks shall not be held responsible for any consequential or incidental harm or loss.


