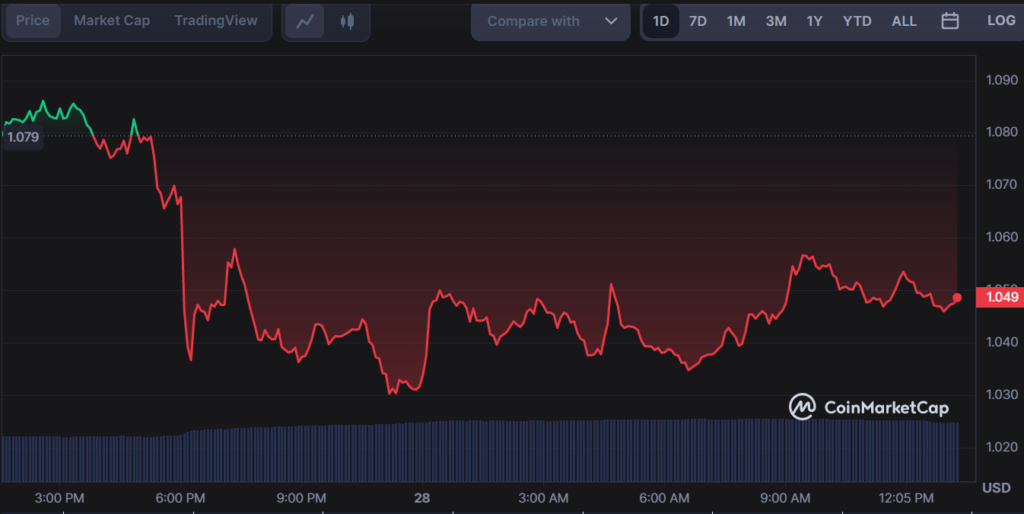
The MATIC/USD pair remained confined to a tight trading range, oscillating between $1.03 and $1.09, as bullish attempts to surpass the crucial resistance level of $1.2 fell short. The absence of any significant upward momentum could be attributed to the subdued investor appetite for altcoins, with Bitcoin continuing to reign supreme in the cryptocurrency arena recently.

The introduction of the Polygon zkEVM mainnet holds great potential for Ethereum, as it offers a solution for scalability and privacy. This development is expected to impact the value of MATIC positively over time. Nevertheless, the MATIC/USD pair may still be susceptible to downward pressure in the short term.
The upcoming critical support level is anticipated to manifest at $0.8, whereas a successful breach above $1.2 can nullify the bearish perspective and propel prices toward the subsequent resistance level of $1.5.
At the onset of the daily trading session, Polygon commenced trading within a horizontal channel, with the MATIC/USD pair encountering resistance in its bid to surpass the $1.2 mark. Notably, MATIC has established lower highs at $1.09, with the price repeatedly failing to breach this level.
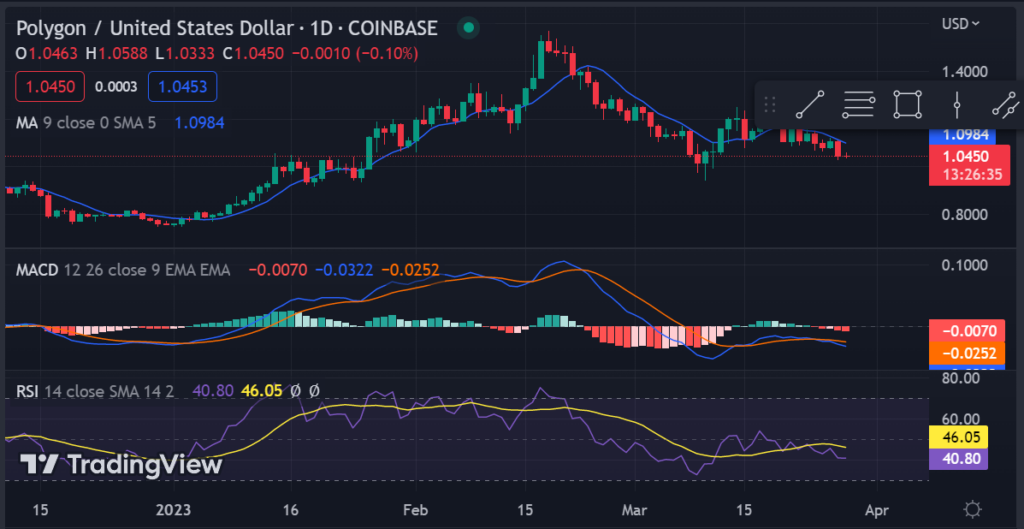
Upon analyzing the daily chart, it is evident that MATIC has been confined within a tight range of $1.03 to $1.09, with the bullish forces failing to surpass the crucial resistance level of $1.2. To rekindle any potential upward momentum in the short run, a breakthrough above this level is imperative for MATIC.
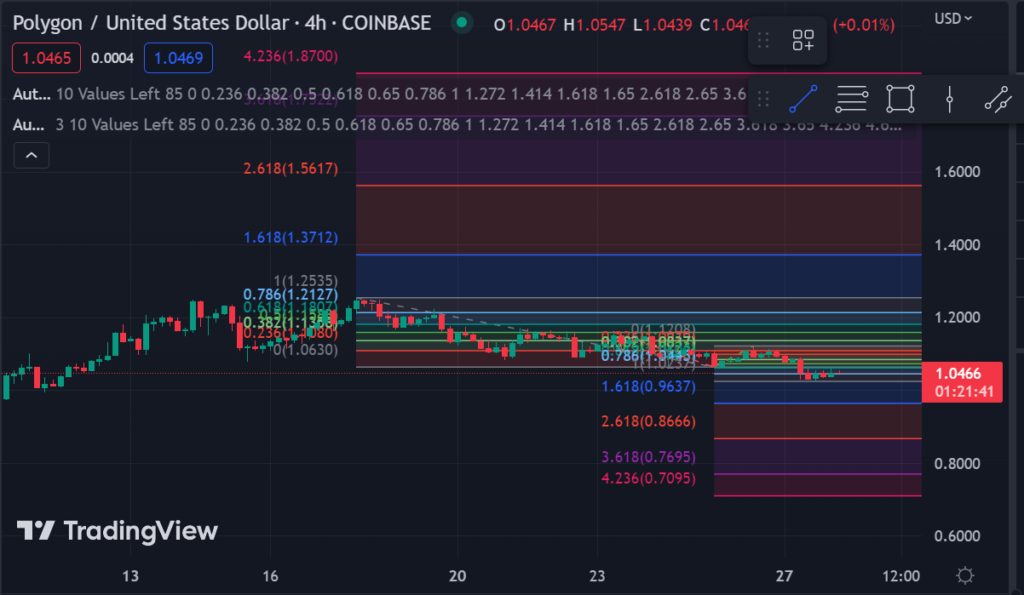
Although there are some concerns, it’s worth noting that the MATIC/USD pair has found support at $0.8. However, if the price continues to decline, it could reach this level. Fortunately, there is some immediate support at the Fibonacci 0.236 level, currently at $0.988. This level may offer relief and cushion for the pair if it continues to experience a downward trend.
According to the Fibonacci extension levels based on the previous swing high of $1.09 and low of $0.80, Polygon may encounter some resistance shortly. If it breaks above $1.2, it is possible to move toward the 0.382 or 0.5 levels at $1.29 and $1.44, respectively. This indicates that further gains for Polygon may be limited in the short term.

According to the latest technical indicators, the market is experiencing a bearish shift. The MACD line has dipped below the signal line and is currently in the negative zone. Additionally, the RSI is trending lower and is hovering near the oversold region. This suggests that the bears currently control the market across all timeframes. As of writing, the price has settled at $1.0476.

Looking toward the future, the bearish sentiment of Polygon can be attributed to the ongoing retracement in the cryptocurrency market. To regain positive momentum in the short term, the bulls must establish a sturdy foundation above the $1.2 level.
Disclaimer: The insights, perspectives, and data presented in this price analysis are published in good faith. Readers must conduct their own research due diligence. Any decision made by the reader is solely their responsibility, and Crypto Outlooks shall not be held responsible for any consequential or incidental harm or loss.


