- PEPE Coin has demonstrated a remarkable performance over the past week.
- PEPE has entered a consolidation phase, maintaining a stable trading range.
- The current trading value of PEPE reflects a modest uptick.
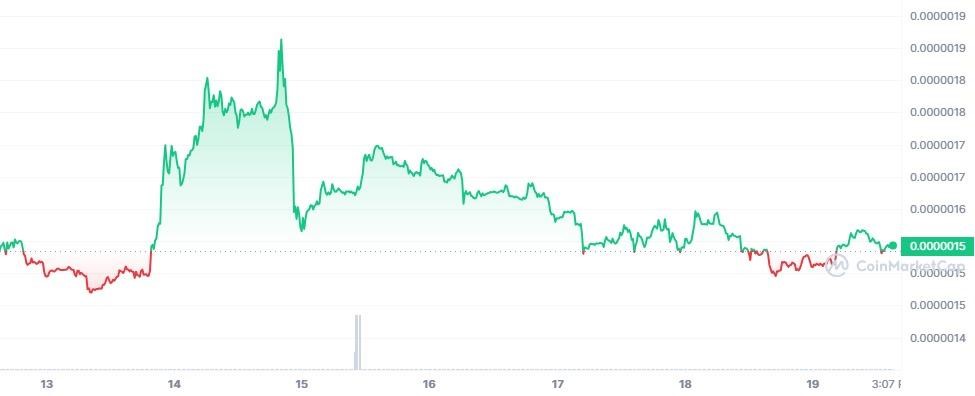
PEPE Coin has demonstrated a remarkable performance over the past week, commencing the trading week at $0.000001535. On the second day, it surged to a peak of $0.000001863. Subsequently, PEPE experienced a gradual decline in its price, forming lower highs until the fifth day. However, from the fifth day onwards, PEPE has entered a consolidation phase, maintaining a stable trading range between $0.0000015 and $0.0000016.

As of the latest update, the current trading value of PEPE stands at $0.000001543, reflecting a modest uptick of 0.38% over the past 24 hours. Additionally, the trading volume for PEPE has experienced a slight decline of 7.62%, amounting to $84,760,078. This decrease in trading activity may indicate a departure of market participants.

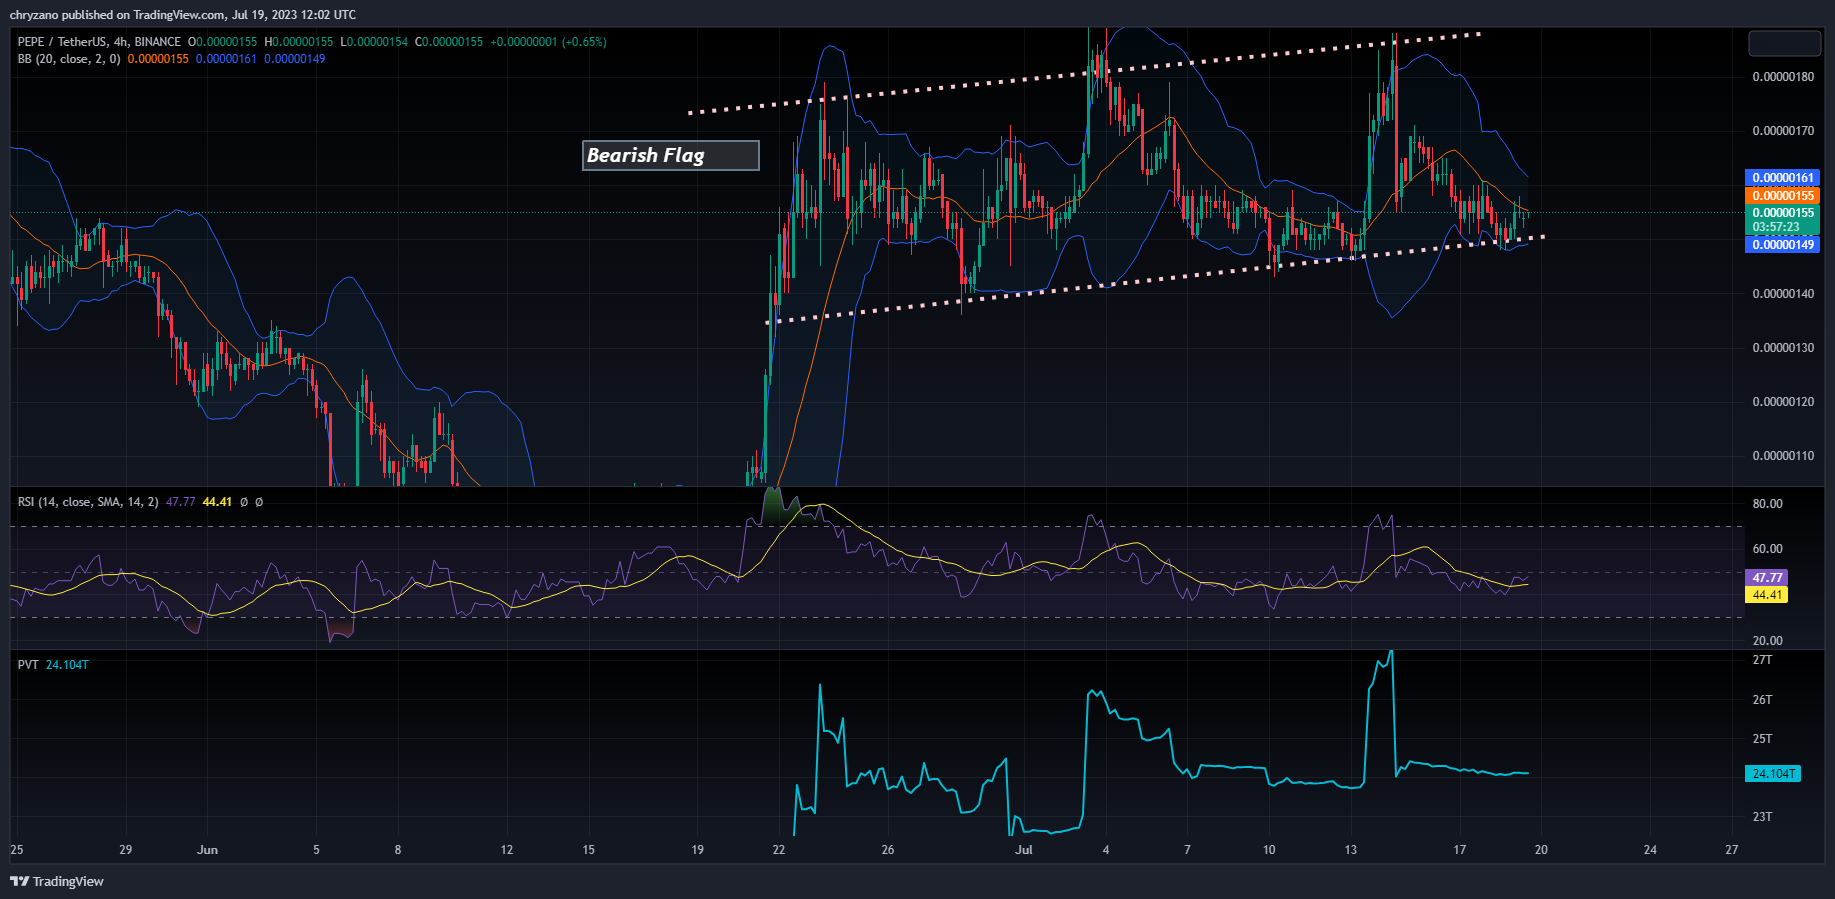
The chart illustrates PEPE’s repeated interaction with both the upper and lower trendlines of the bearish flag. PEPE is displaying a rebound from the lower trendline, indicating a potential upward movement. Nevertheless, there appears to be a notable resistance near the Simple Moving Average of the Bollinger bands. Consequently, there exists a likelihood for PEPE to reverse its trajectory and seek support from the lower trendline of the bearish flag, as observed in previous instances.
Given the current state of the Bollinger Bands, there is a decrease in market volatility, resulting in potentially minimal price movements. Additionally, the Relative Strength Index (RSI) indicates a value of 47.77, with the RSI line showing an upward tilt. This suggests that PEPE is experiencing a strong trend. Should PEPE successfully breach the Simple Moving Average (SMA), it can reach a price of $0.00000187.
When analyzing the breakout of PEPE from the flag pattern, the current interaction with the lower trendline does not indicate a significant breakout point. This observation is supported by the Volume Price Trend indicator (VPT), which currently registers a value of 24.104T. It is worth noting that the VPT of PEPE has consistently hovered around this reading whenever it has touched the lower trendline. Therefore, it is plausible to consider this as just another intersection point rather than a significant breakout.

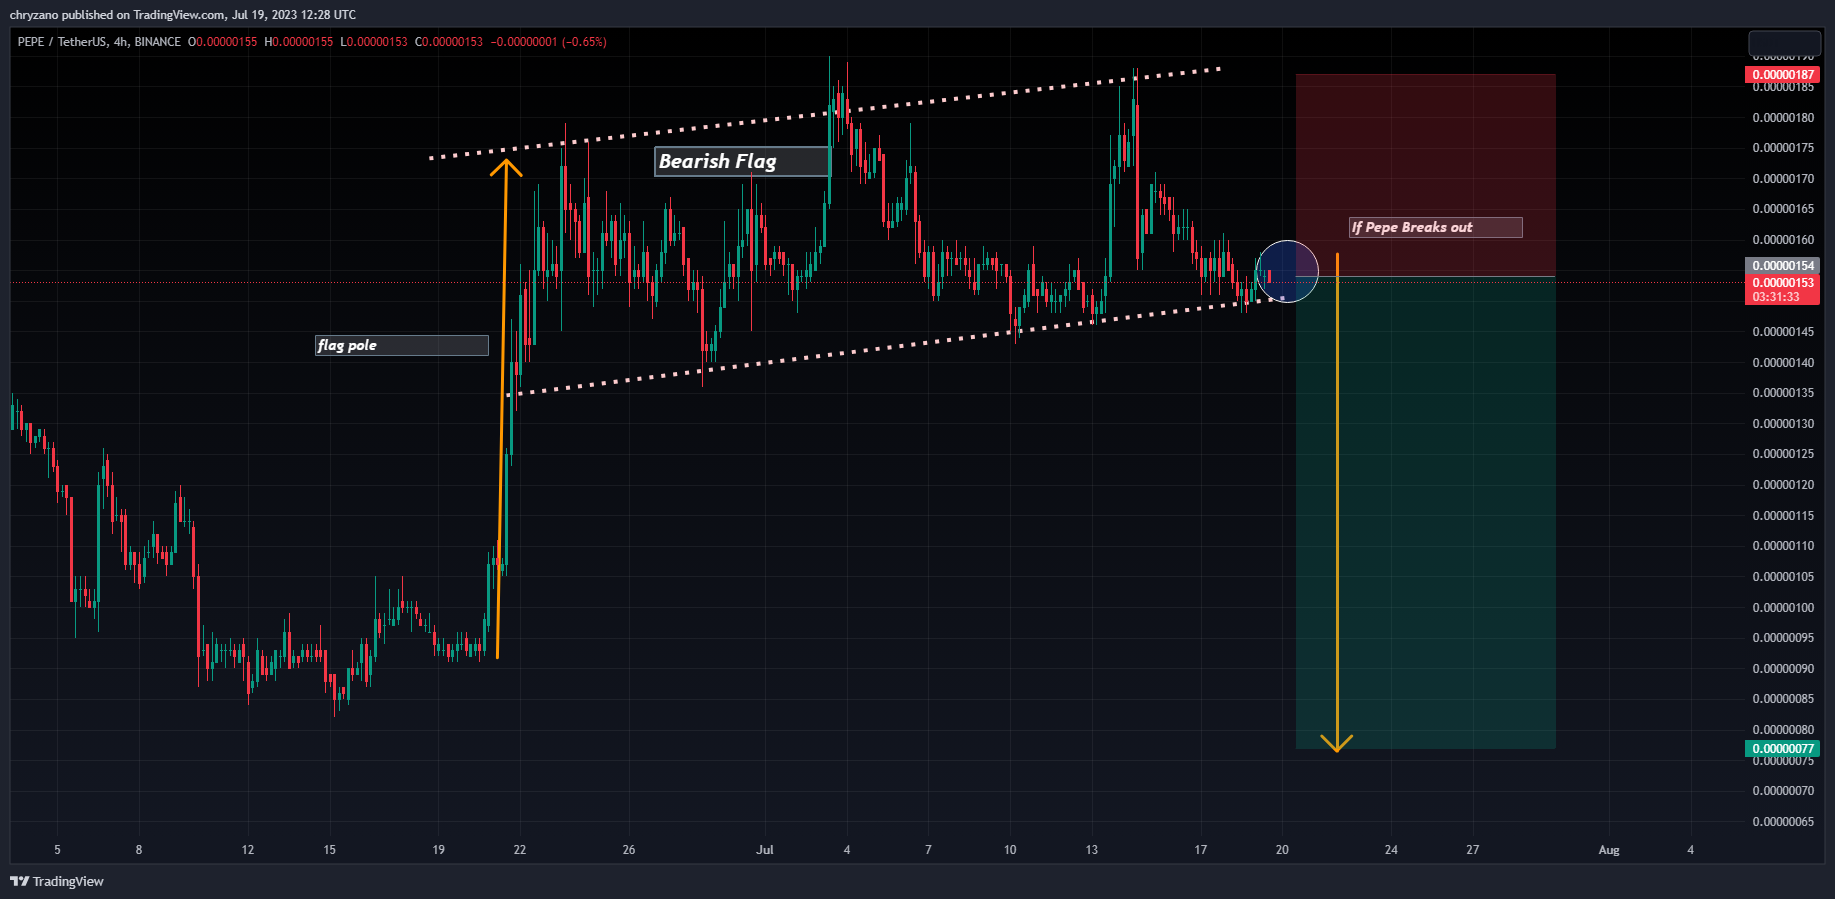
However, if PEPE defies market trends and successfully breaks out from the bearish flag pattern, a downward movement is possible. In such a scenario, sellers should take immediate action. Following the recommended trading strategy for bearish flags, sellers may consider entering the market just below the breakout point and setting their take-profit level at a distance equivalent to the length of the flag pole. If a decline, PEPE may find support at the price level of $0.0000009.
Disclaimer: The insights, perspectives, and data presented in this price analysis are published in good faith. Readers must conduct their own research due diligence. Any decision made by the reader is solely their responsibility, and Crypto Outlooks shall not be held responsible for any consequential or incidental harm or loss.


