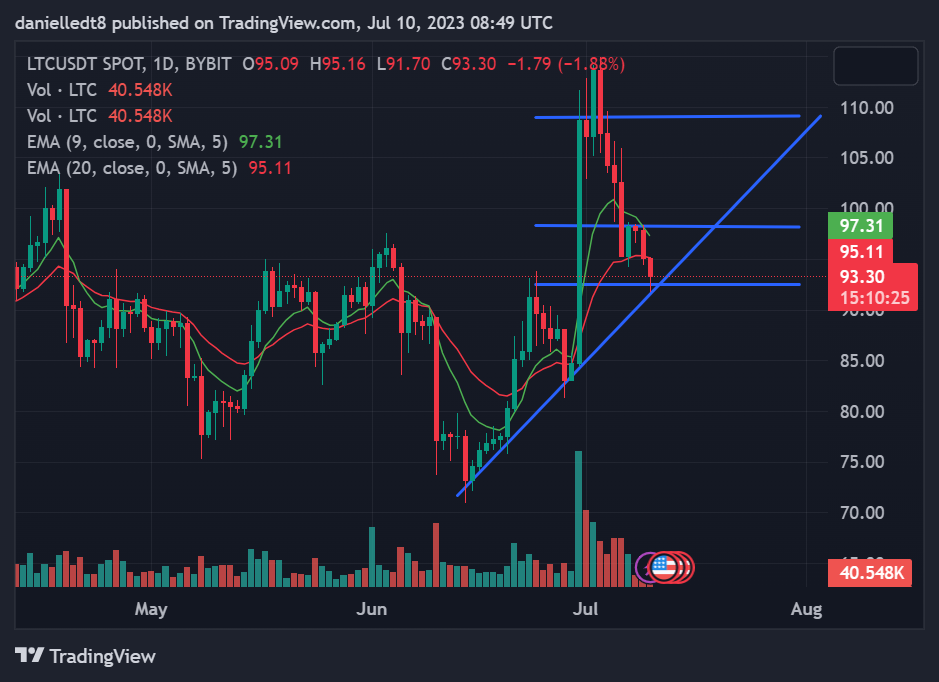
- Falling wedge pattern on LTC chart could trigger bullish movement.
- LTC’s price declined over 3% due to upcoming halving event.
- LTC’s market capitalization ranks 11th, surpassed by Tron (TRX).
In a recent tweet, renowned crypto analyst CryptoFaibik highlighted the presence of a falling wedge pattern on the low timeframe (LTF) chart for Litecoin (LTC). This pattern, if confirmed, could potentially trigger a substantial bullish movement. Additionally, the analyst emphasized the significance of the upcoming LTC halving event, which is a mere 23 days away.
In light of the upcoming halving event, CoinMarketCap reported a decline of over 3% in LTC’s price during the last 24 hours of trading. Consequently, the altcoin was being exchanged at $93.32 at the time of reporting, slightly above its daily low of $93.20.
LTC’s negative performance worsened as it recorded a 24-hour loss, further plunging its weekly performance to -16.70%. Moreover, the cryptocurrency witnessed a significant surge in its 24-hour trading volume, reaching approximately $572,566,523, representing a remarkable increase of over 40% within the past day.
With a market capitalization of $6,842,802,882, Litecoin (LTC) secured its position as the 11th largest cryptocurrency in the market. However, its ranking was recently surpassed by Tron (TRX), which now holds the 10th spot with a market capitalization of $6,907,189,252.

LTC’s daily chart exhibited a promising upward trajectory, recording two consecutive higher lows in recent weeks. The initial low occurred on 20 June 2023, with LTC reaching $75.73. Subsequently, on 29 June 2023, LTC established a higher low at $82.94, further reinforcing the positive trend.
If LTC’s price maintains a closing above the support level of $92.37 for today’s and tomorrow’s daily candles, it could indicate the formation of another higher low. In such a scenario, LTC’s price might attempt to breach the resistance level at $100 within the next 48 hours.
A breach above the $100 mark will pave the way for Litecoin’s price to ascend towards the subsequent resistance level of $109.25 within the upcoming week. Nevertheless, this optimistic outlook will be invalid if the cryptocurrency’s price concludes a daily candle below the mentioned support level of $92.37 within the next 48 hours. In such a scenario, Litecoin may experience a decline towards the $85 mark.
Disclaimer: The insights, perspectives, and data presented in this price analysis are published in good faith. Readers must conduct their own research due diligence. Any decision made by the reader is solely their responsibility, and Crypto Outlooks shall not be held responsible for any consequential or incidental harm or loss.


