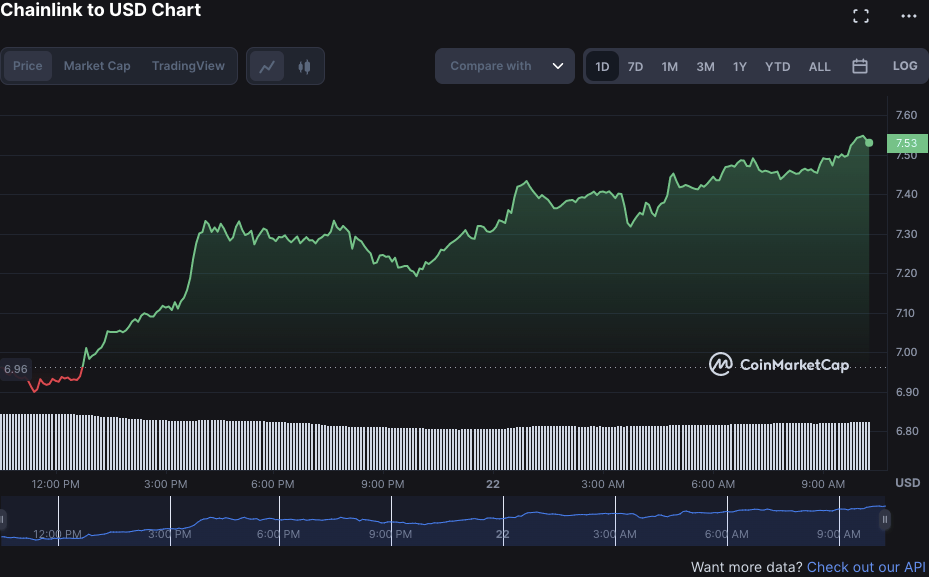
According to the latest Chainlink price analysis, the market is experiencing a bullish trend with a notable surge in the past 24 hours. This positive momentum has been consistent over the past few days, resulting in a significant price increase. The LINK/USD pair has impressively climbed to $7.53, indicating a growing interest from investors in the token.

The bulls are flexing their muscles and propelling the token to new heights. The formidable resistance level at $7.55 has been shattered, paving the way for an imminent surge. Should the bulls triumph over the next hurdle at $7.60, we can anticipate a substantial uptick in the LINK token’s value. Meanwhile, the support level remains robust at $6.90, providing a reliable safety net in the event of a downward correction.
The LINK/USD pair is exhibiting a robust bullish momentum on the daily chart, with the current price trading above the $7.50 level and a notable 5.97 percent increase in the past 24 hours. Despite a decrease in 24-hour trading volume, buyers are proceeding with caution. The market capitalization currently stands at $3.89 billion, with an impressive 8.39 percent increase in the past 24 hours. If the bulls continue to dominate the market, we can expect further growth in market capitalization.

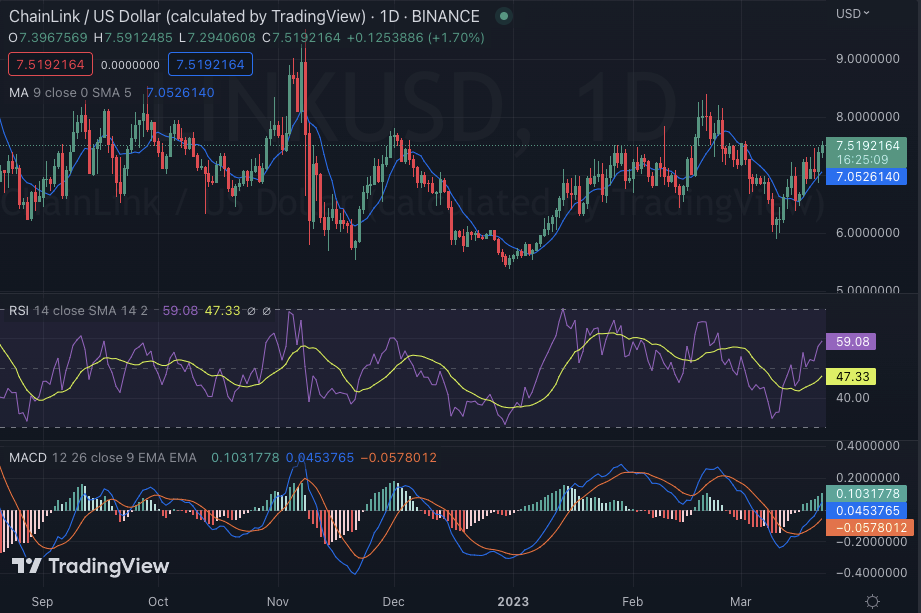
The technical indicators paint a promising picture, with the moving average indicator exhibiting a bullish crossover. On the daily chart, the MA is currently at $7.05 and displaying an upward trajectory. The relative strength index (RSI) is also at a noteworthy high of 59.08, signaling that the buyers are firmly in charge of the market. Additionally, glancing at the MACD oscillator graph reveals a substantial uptick in buying pressure. All in all, the data suggests a bullish trend that investors should keep a close eye on.
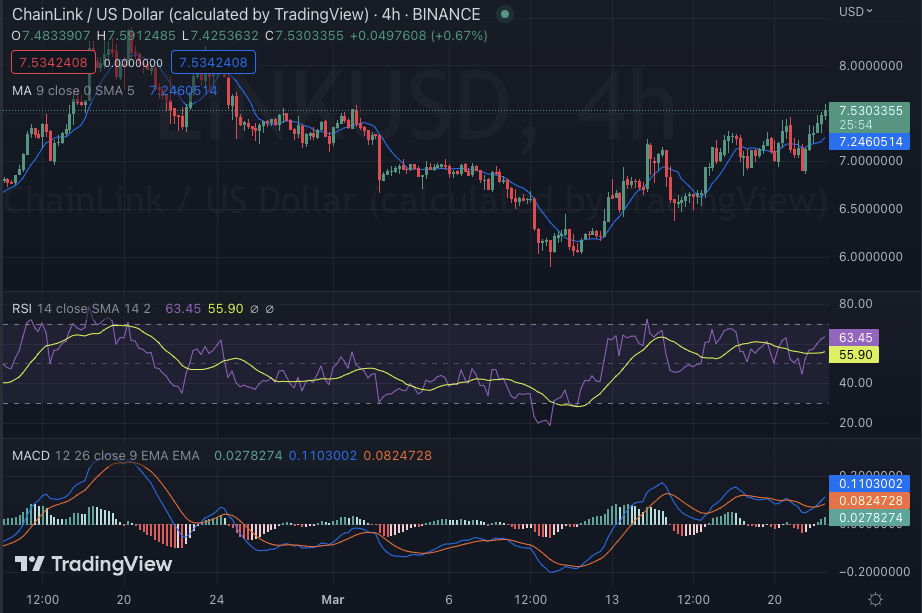
According to the 4-hour chart analysis of Chainlink’s price, the token has experienced a rebound today following a bearish trend yesterday. Over the past 24 hours, the token has been trading within a range of $6.90 to $7.55, with the former representing the support level and the latter the resistance level. Currently, the token is trading towards the upper end of this range, indicating a strong presence of buyers in the market.

The technical indicators on an hourly basis display bullish trends, with the RSI surpassing the 60 levels and heading towards the overbought territory. This suggests that the buying pressure is on the rise. Additionally, the Moving Average Converges Divergence (MACD) is still in the bullish region, with green lines crossing over each other on the histogram. The 4-hour moving average is currently at $7.24, just below the current price, which is a positive indication for the token. Overall, these technical indicators are pointing towards a promising future for the token.
To sum up, after a thorough analysis of LINK/USD, it is evident that the market is currently under the reign of the bulls. With their continued dominance, the price is anticipated to soar towards the $7.60 level shortly. This prediction is further supported by the positive trends reflected in the technical indicators. However, watching the support and resistance levels is crucial, as they can shift the movement in either direction at any given moment. As a professional, it is imperative to stay vigilant and adapt accordingly.
Disclaimer: The insights, perspectives, and data presented in this price analysis are published in good faith. Readers must conduct their own research due diligence. Any decision made by the reader is solely their responsibility, and Crypto Outlooks shall not be held responsible for any consequential or incidental harm or loss.


