- Solana (SOL) has seen a 7.22% increase, reaching $24.94 recently.
- The Awesome Oscillator indicates bullish influences propelling SOL’s momentum.
- The ADX indicator implies SOL experienced robust upward price fluctuation.
Over the recent weeks, the cryptocurrency market has persistently demonstrated its characteristic cyclical fluctuations. Like Bitcoin
Contrary to the prevailing trend among alternative cryptocurrencies, Solana
Optimistic Indicators
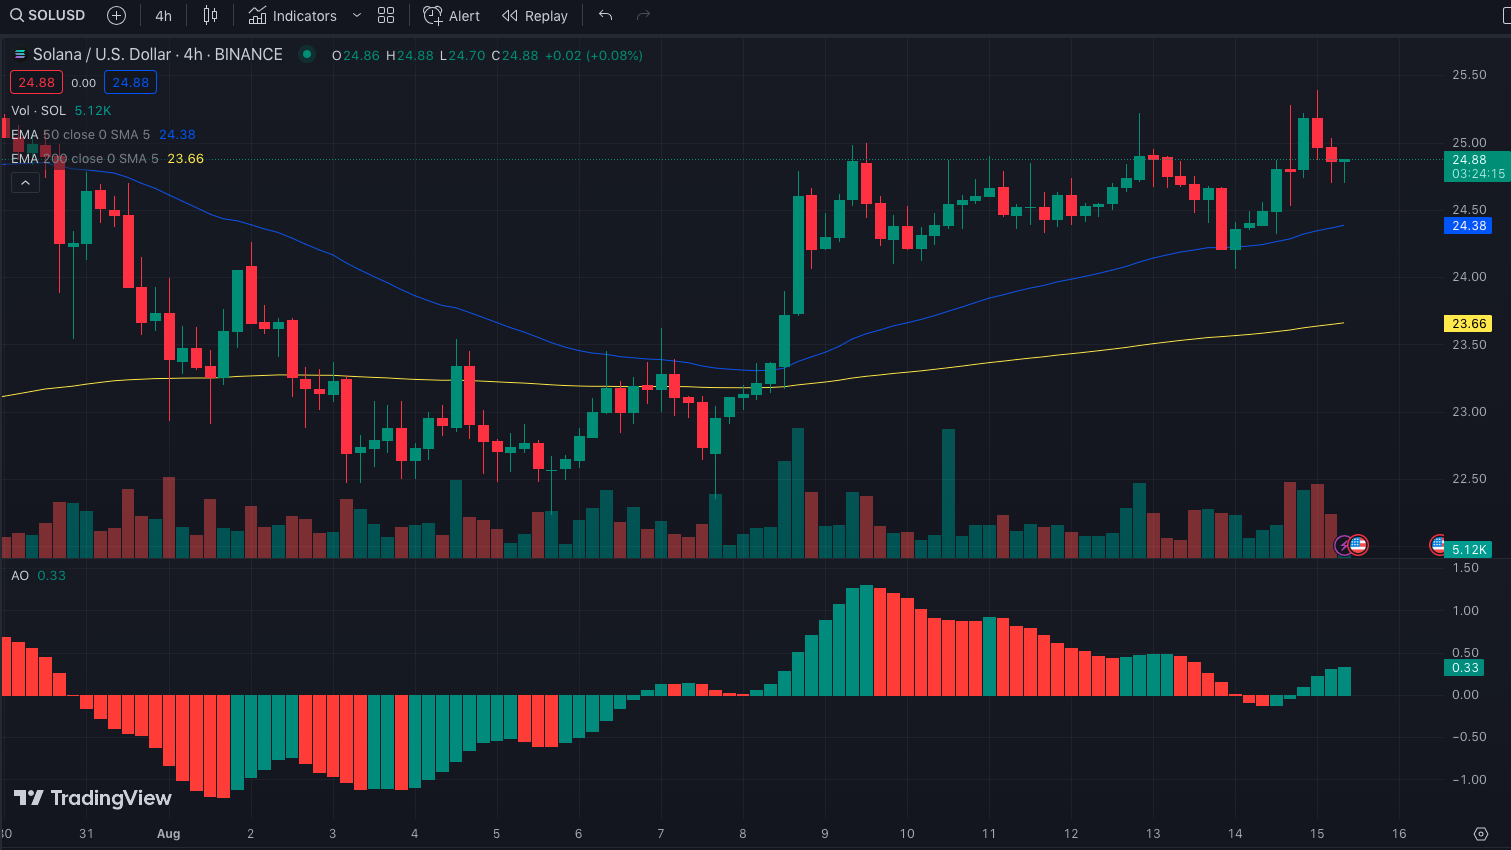
On the 4-hour SOL/USD chart, the Awesome Oscillator (AO) has transitioned into positive territory, registering at 0.33. This positive AO reading indicates that the 5-period Moving Average (MA) surpasses the 34-period MA.
The positive AO indicates that bullish influences are propelling SOL’s momentum. Additionally, insights from the Exponential Moving Average (EMA) reveal that the 50 EMA (depicted in blue) is positioned above the 200 EMA (represented in yellow). This is generally interpreted as a signal for SOL to prolong its bullish trajectory over an extended period.
Nonetheless, the absence of a golden cross on the 4-hour chart failed to validate the rally. In crypto trading, a golden cross is a bullish signal when the short-term Exponential Moving Average (EMA) surpasses the long-term EMA. If future patterns mirror this crossover, SOL has the potential to surge up to 25% above its current price of $24.78.

In addition to the technical perspective, SOL might require external influences for the surge to materialize. Growth in network engagement and a rise in market involvement could significantly impact the price movement.
SOL Seems Ready for Another Bullish Run
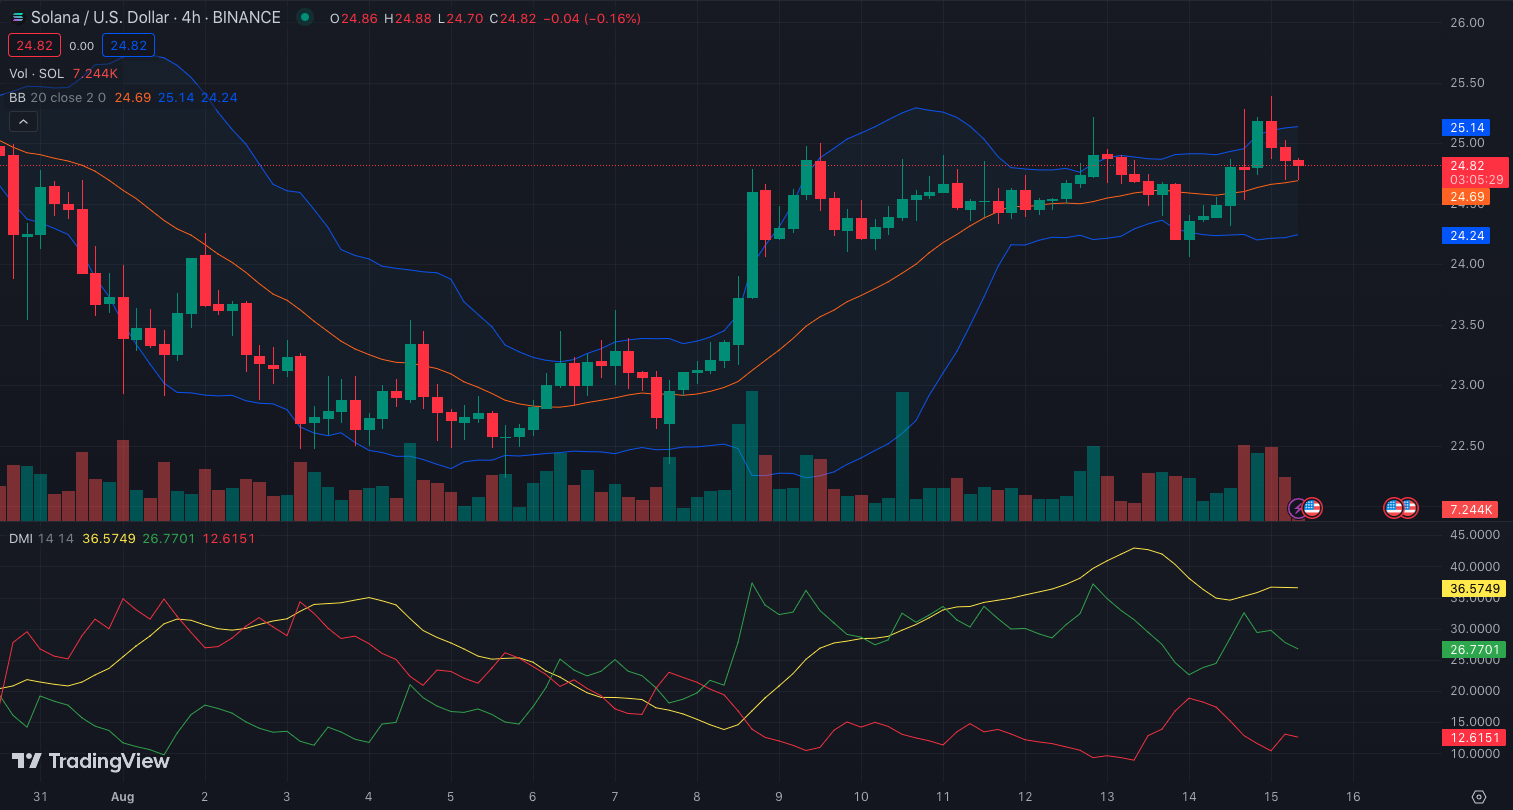
Regarding the Directional Movement Index (DMI) on the 4-hour chart, SOL demonstrated significant directional strength. As of the latest update, the +DMI (green) surpassed the -DMI (red), standing at 26.77 compared to 12.61, respectively.
The dominance of +DMI indicates that the purchasing power still lies with the buyers in the market. Concurrently, the Average Directional Index (ADX) stands at 36.57. The ADX, represented in yellow, is a gauge of directional momentum, with its scale ranging from zero to 45. An ADX value exceeding 25 signifies a robust directional movement in the asset’s price. Conversely, values falling under 25 denote a lack of strong directional momentum in the price.

Hence, the ADX indicator implies that SOL experienced a more robust upward price fluctuation. The expanding volatility, as evidenced by the Bollinger Bands and surging demand, could propel SOL towards the $30 trading zone shortly.
Disclaimer: The insights, perspectives, and data presented in this price analysis are published in good faith. Readers must conduct their own research due diligence. Any decision made by the reader is solely their responsibility, and Crypto Outlooks shall not be held responsible for any consequential or incidental harm or loss.


