- SHIB successfully breached the $0.000008 resistance level on five occasions.
- SHIB reached $0.0000086 on July 31, confirming a positive trend.
- The On-Balance-Volume indicates accumulation of SHIB tokens and potential breakout.
Since Shiba Inu (SHIB) experienced a significant decline to $0.000006 in June, surpassing the $0.000008 resistance level has proven challenging. Nevertheless, despite numerous unsuccessful endeavors, SHIB has successfully breached this psychological barrier on five separate occasions within the past fortnight.
On July 15, SHIB made a significant breakthrough by surpassing the $0.0000083 mark. However, this upward movement was short-lived, as the token experienced a decline to $0.0000077 just three days later. Despite the selling pressure observed on July 15 and 18, SHIB continued its ascent and reached $0.0000086 on July 31. This achievement served as a confirmation of the breakout, indicating a positive trend in the market.
Frequently, when an asset surpasses this threshold, it signifies the initiation of a fresh trend. According to CoinMarketCap’s data, SHIB has recorded a notable surge of 7.25% within the past 24 hours.
Accumulation may trigger a fresh surge
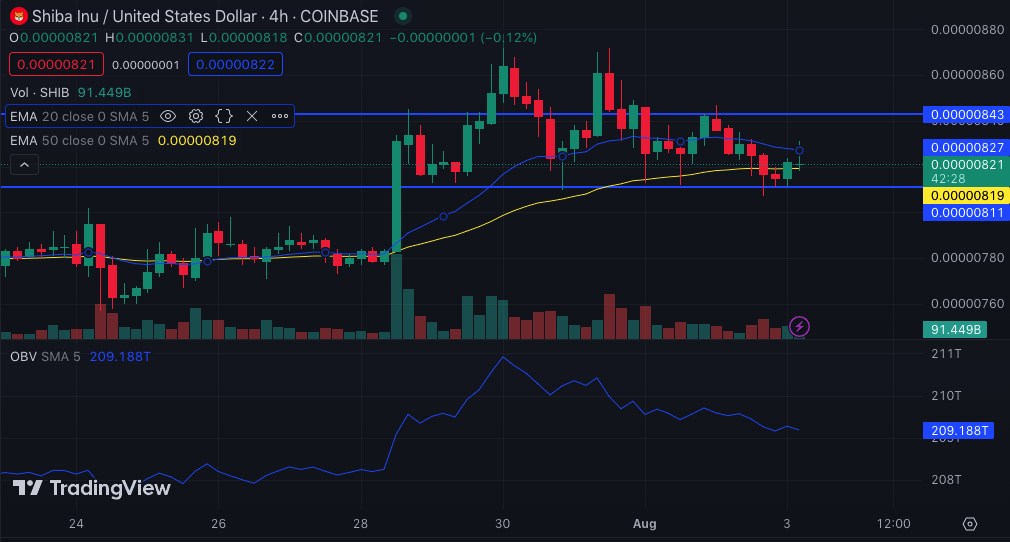
Based on the 4-hour chart analysis of SHIB/USD, a significant round of profit-taking was observed as SHIB reached the price level of $0.0000084. This led to a temporary decline in the meme’s value, with sell orders driving it down to $0.0000081. However, it is noteworthy that demand swiftly resurfaced at this particular level, indicating a potential support zone for SHIB.
Moreover, the Exponential Moving Average (EMA) suggests that there is a potential for the meme to continue its upward trend, as indicated by its recent formation of a bullish structure. The 20 EMA (blue) has successfully crossed above the 50 EMA (yellow) since July 28, indicating a positive signal for the cryptocurrency.
If the EMAs continue to uphold their current position, SHIB has the potential to embark on another upward trajectory, potentially surpassing the $0.000009 mark. An analysis of the On-Balance-Volume (OBV) indicates that the indicator displayed indications of an increase during a recent period of stagnation.
The upward movement of the On-Balance-Volume (OBV) indicates a significant accumulation of SHIB tokens, while the declining distribution suggests a decrease in selling pressure. Should the OBV continue to surge beyond the 209.18 trillion mark, it could trigger a breakout for SHIB, propelling its price towards the $0.00001 level.

Keep an eye on the movement
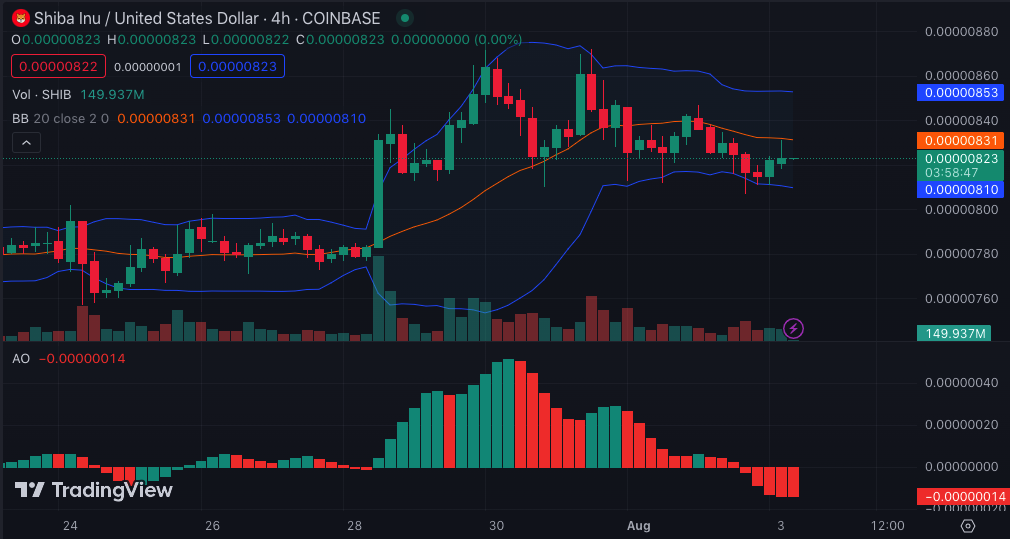
About volatility, the Bollinger Bands (BB) indicate that SHIB has exhibited a consistent level of volatility since July 31. Nevertheless, the BB analysis also highlights that the lower band intersected with SHIB for $0.00000811.
This suggests that SHIB was excessively sold at the mentioned price, leading to a subsequent upward reversal in the trend. Nevertheless, traders should exercise caution and closely monitor the Awesome Oscillator (AO).
The latest update shows that the AO is in a bearish state. A bullish AO signifies that the fast-moving average surpasses the slow-moving average, while a reading below the zero line suggests that the slow-moving average outperforms the fast-moving average.

If the AO remains within the red region, the potential increase to $0.000009 could be suppressed. Nevertheless, should the buying pressure intensify, the AO can ascend towards the zero-mid point, potentially driving an upward movement in SHIB’s price.
Disclaimer: The insights, perspectives, and data presented in this price analysis are published in good faith. Readers must conduct their own research due diligence. Any decision made by the reader is solely their responsibility, and Crypto Outlooks shall not be held responsible for any consequential or incidental harm or loss.


