- Ripple’s XRP experienced a 7.14% decline in value in June.
- XRP’s initial outperformance against Bitcoin was only temporary.
- XRP’s purchasing power has strengthened, indicating potential for a bullish breakout.
Ripple’s (XRP) performance in June fell short of bullish expectations, as the token predominantly experienced consolidation throughout the month, with only sporadic upward movements.
Consequently, XRP concluded the month slightly below $0.50, experiencing a 7.14% decline in value over the past 30 days. This decline in performance against Bitcoin (BTC), which currently stands above $30,000, indicates that XRP’s initial outperformance against the leading cryptocurrency was only temporary.
Are These Signs of Recovery?
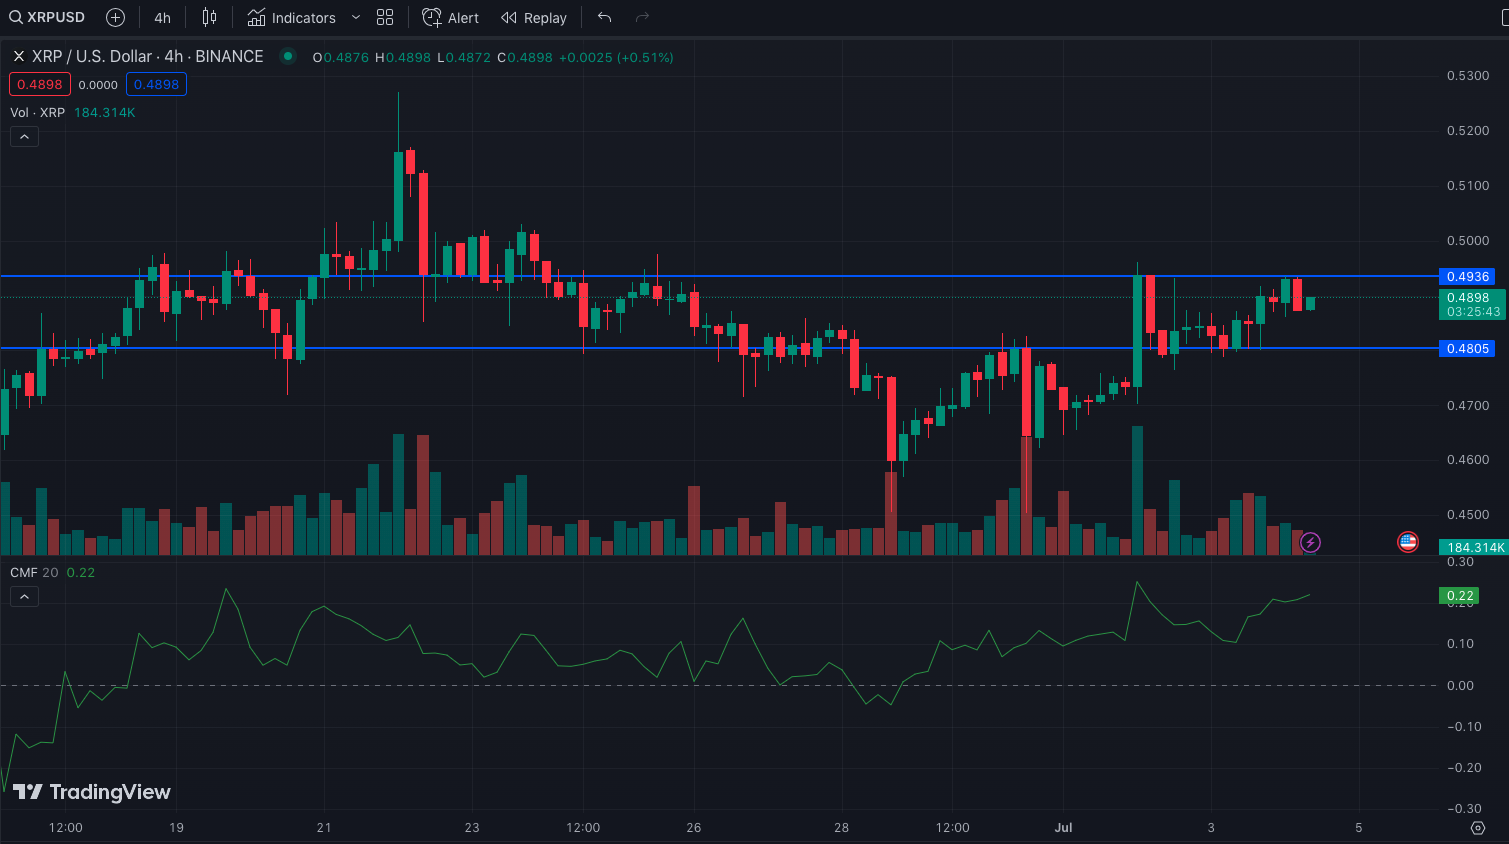
In July, XRP had already begun its efforts to establish a bullish market structure. Analyzing the XRP/USD 4-hour chart, it was observed that the dominance of bulls at the $0.48 level was initially uncertain, but it appeared to have been reclaimed around the $0.49 mark.
The preceding setback can be attributed to a diminished level of demand. However, it is noteworthy that the Chaikin Money Flow (CMF) has surged to 0.22 as of the current moment.
Hence, this oscillation point suggests that XRP’s purchasing power has strengthened, as evidenced by the CMF surpassing 0.20. Although there was a possibility of becoming overbought, a decline towards a CMF level of 0.20 would signal the potential for XRP to initiate a bullish breakout.

Therefore, it is advisable for traders to closely monitor the $0.48 level as a potential area for accumulation. If demand strengthens at this level, XRP’s price movement could experience a significant upward surge, causing losses for bearish traders. Conversely, if selling pressure surpasses the control of bullish traders, XRP may be traded below the $0.48 mark.
Subject to Conditions
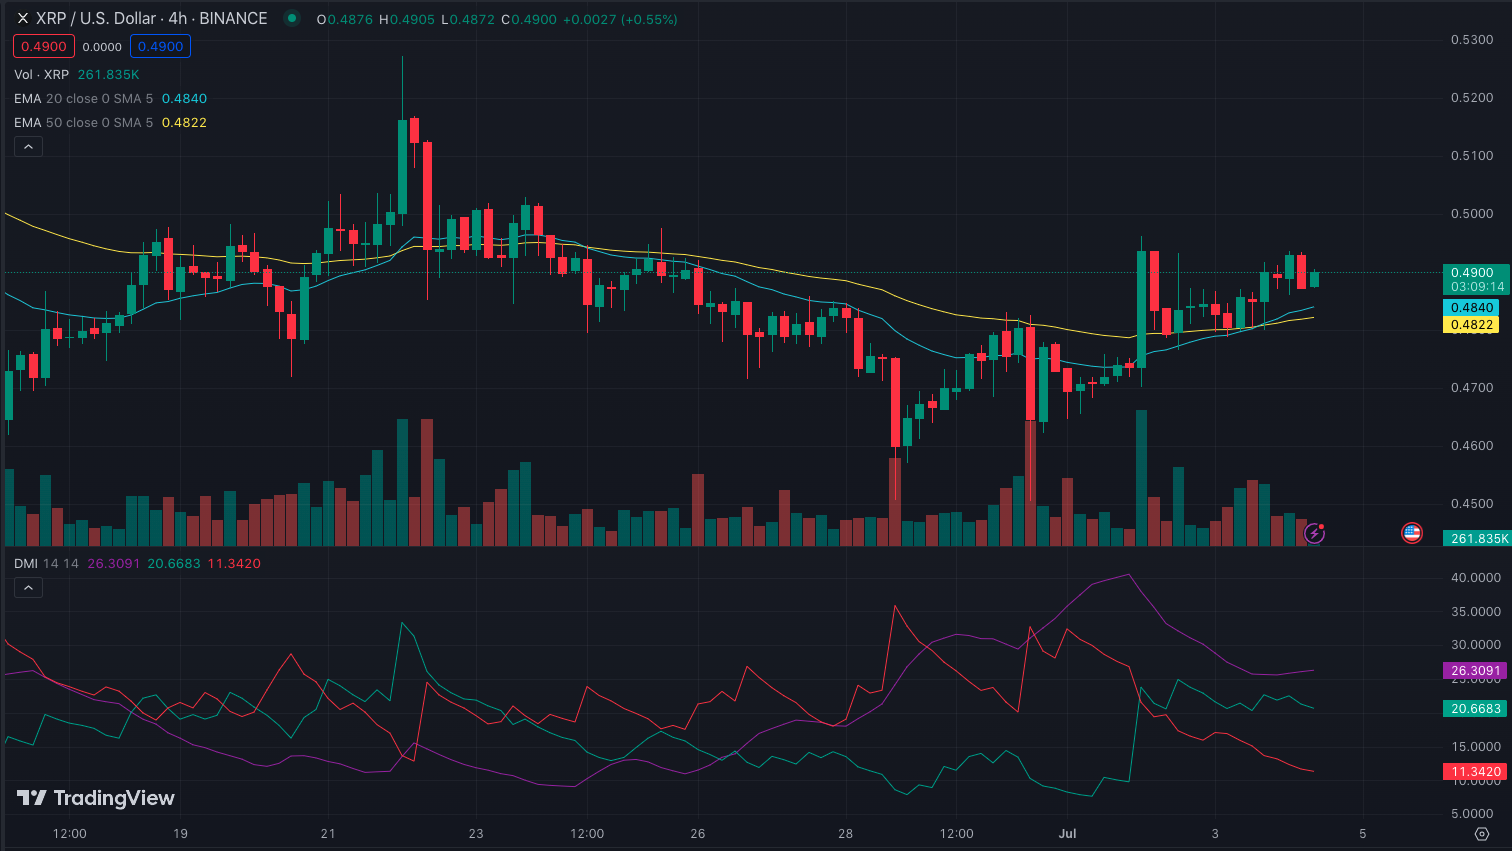
Moreover, the Exponential Moving Average (EMA) indicated a bullish trend for the token, suggesting potential upward momentum rather than a downward trajectory. This was evident as the 20-day EMA (cyan) surpassed the 50-day EMA (yellow), a significant technical signal in the crypto industry.
When such a scenario unfolds in the crypto industry, it indicates a potentially bullish trend. Consequently, the likelihood of a sell/short trend overpowering buyers’ dominance becomes minimal. Nevertheless, it is crucial to consider the Directional Movement Index (DMI) as it may influence this outcome.
As of the current press time, the positive directional movement indicator (+DMI) stood at 20.66, while the negative directional movement indicator (-DMI) was recorded at 11.34. This significant difference indicates a dominant bullish sentiment, signifying the successful elimination of selling pressure.
Furthermore, the Average Directional Index (ADX) registered a value of 26.30, indicating a significant directional movement for the asset. An ADX reading above 25 in cryptocurrency, as observed in the purple line, signifies a robust trend. Consequently, this was indeed the scenario for XRP.

For the upward trend to sustain, the ADX must maintain its position above the mentioned level. The longevity of buying pressure will also play a significant role in this regard.
Disclaimer: The insights, perspectives, and data presented in this price analysis are published in good faith. Readers must conduct their own research due diligence. Any decision made by the reader is solely their responsibility, and Crypto Outlooks shall not be held responsible for any consequential or incidental harm or loss.


