- Chainlink (LINK) surged to $7.85 on August 9 due to Bitcoin’s rebound.
- LINK’s value depreciated by 0.59% over the past 24 hours to $7.55.
- LINK’s overbought status led to a price correction, declining the RSI to 54.07.
On August 9, Chainlink
Nonetheless, the surge has tempered as BTC concurrently wiped out its latest profits. As of the latest update, LINK is being exchanged at $7.55, experiencing a 0.59% depreciation over the past 24 hours.
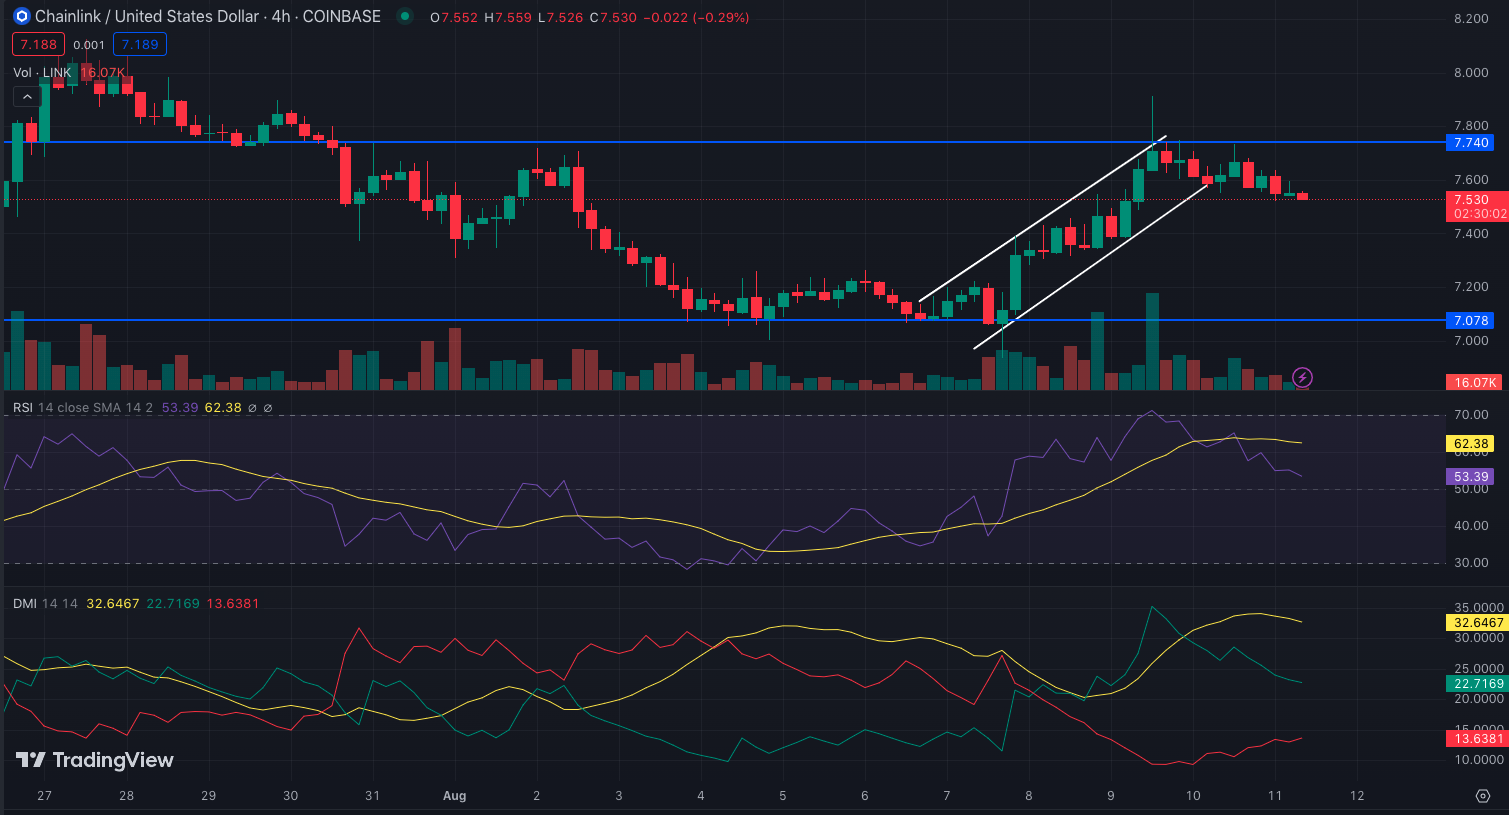
In the 4-hour chart, the upward trajectory of LINK was initiated by the bullish determination to establish demand at $7.07 on August 6. This buying momentum confirmed that LINK’s market configuration was bullish, as evidenced by the price surge.
LINK’s decline is driven by profit-taking
However, after peaking at $7.85, SHIB encountered a resistance level of $7.74. Despite multiple efforts by bullish traders to propel it towards the $8 mark, they repeatedly faced denial at the same resistance zone.
The surge led to a significant rise in the Relative Strength Index (RSI), reaching 71.10. However, an RSI exceeding 70 typically signifies an overbought condition for LINK. This overbought status subsequently influenced a price correction, reflected in the RSI’s decline to 54.07.
The downturn may also indicate a period of profit realization, implying that if the selling momentum persists, LINK could fall below the $7.40 mark. Conversely, should the trend of large-scale investors, or ‘whales’, persist in accumulating LINK, the next price objective for the cryptocurrency could range from $7.9 to $8.5.
When drafting this, the +DMI (bullish) remained superior to the -DMI (bearish), standing at 22.71 and 13.36, respectively. This disparity suggests a slight decrease in the dominance of buyers. However, it doesn’t necessarily imply that sellers have gained full control.
The Average Directional Index (DMI) also stood at 32.64, indicating a robust directional trend. For LINK to reach the $8 mark, the +DMI must shift back to an upward trajectory, given that the ADX (represented in yellow) is endorsing a firm direction.

Entering at $7.40 could be a good move
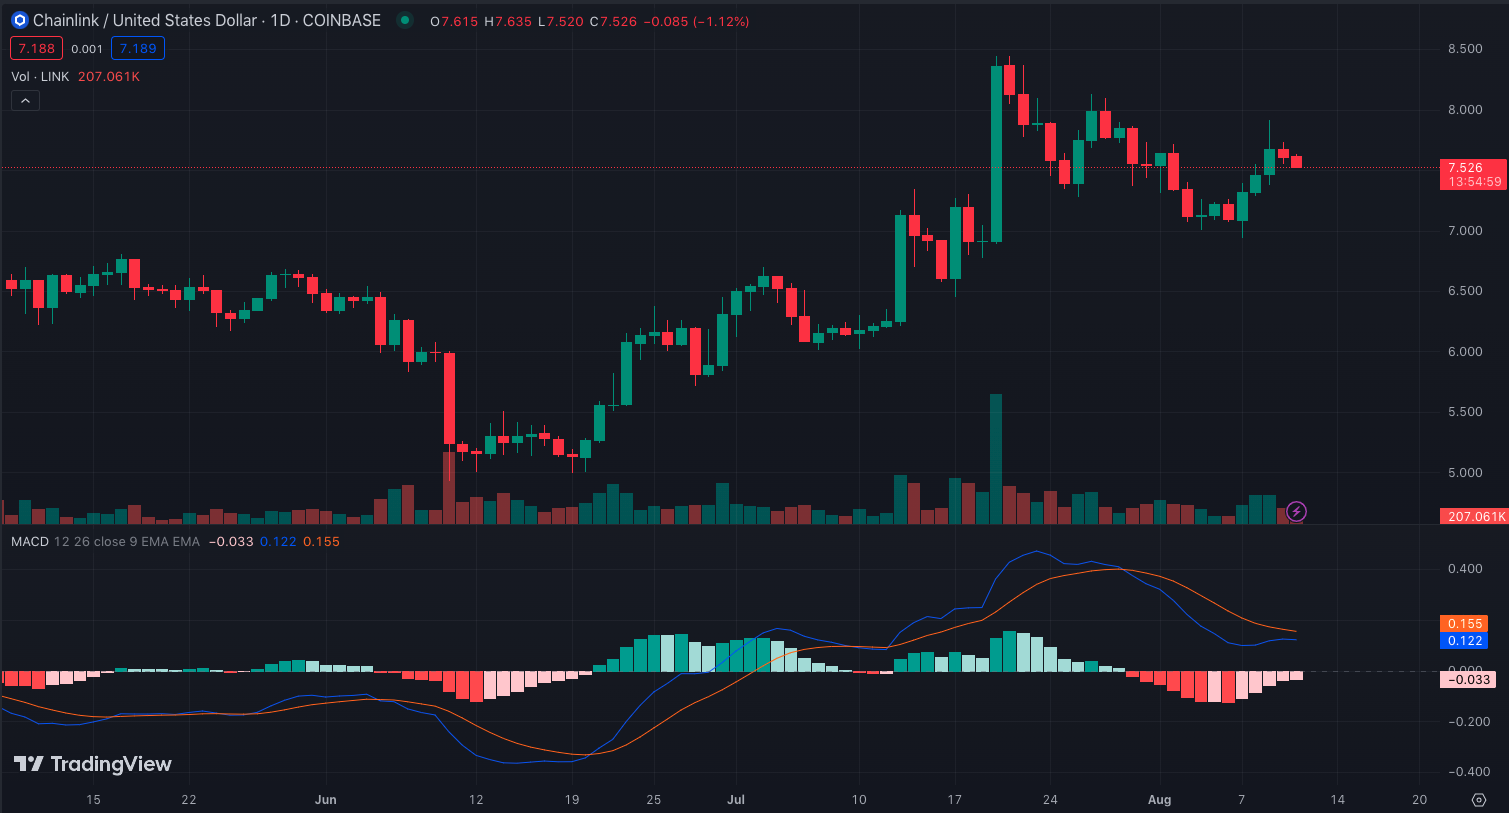
The indicator was negative according to the Moving Average Convergence Divergence (MACD) on the daily chart. In crypto trading, this negative MACD suggests that the 12-day Exponential Moving Average (EMA) has further diverged below the 26-day EMA.
This implies that there is an escalating bearish momentum. Unless the MACD indicates a shift to bullish momentum and the orange trend line dips beneath the blue line, there’s a potential for further depreciation in LINK’s value.

Even so, a continued decline in LINK’s value doesn’t rule out the potential for a rebound. Should the token reach a price point of $7.40, it may present an attractive opportunity for traders interested in taking a long position on LINK.
Disclaimer: The insights, perspectives, and data presented in this price analysis are published in good faith. Readers must conduct their own research due diligence. Any decision made by the reader is solely their responsibility, and Crypto Outlooks shall not be held responsible for any consequential or incidental harm or loss.


