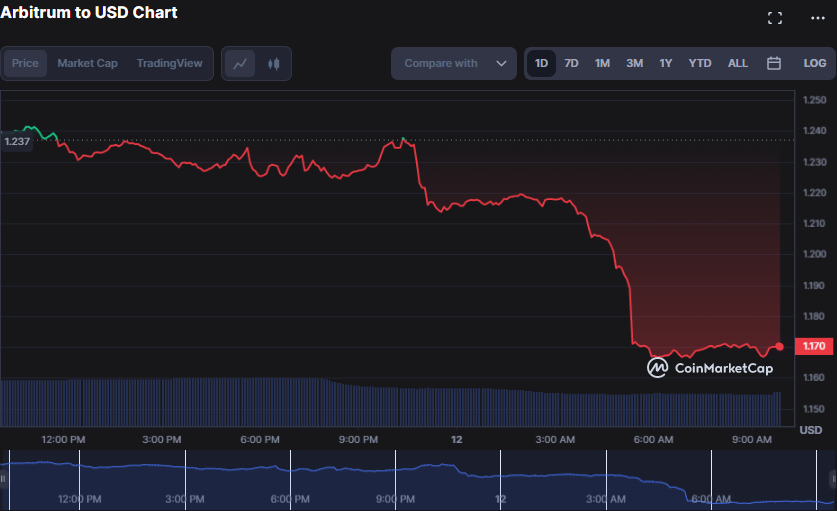
Following a promising surge that saw the Arbitrum (ARB) price reach a 24-hour high of $1.24, the market took a bearish turn, resulting in a 5.33% drop to $1.17 within hours. As of press time, the bears remain in control, and should they break through the current support level, the price of ARB may continue to decline, potentially reaching the next support level at $1.10. Investors must monitor the market closely and make informed decisions based on the latest developments.
If the bulls seize the reins and propel ARB’s price beyond the $1.24 threshold, it could signal a promising upward trajectory for the asset. Unfortunately, the recent economic downturn has caused both the market capitalization and 24-hour trading volume to recede by 5.24% and 24.10%, respectively, resulting in figures of $1,495,666,675 and $343,751,177.
The recent market dip indicates a growing sense of prudence among investors, who may hold off on major transactions until conditions stabilize. Yet, for those with a long-term investment outlook, this could present a unique opportunity to enter the market at a more favorable price point, potentially yielding greater returns down the line.

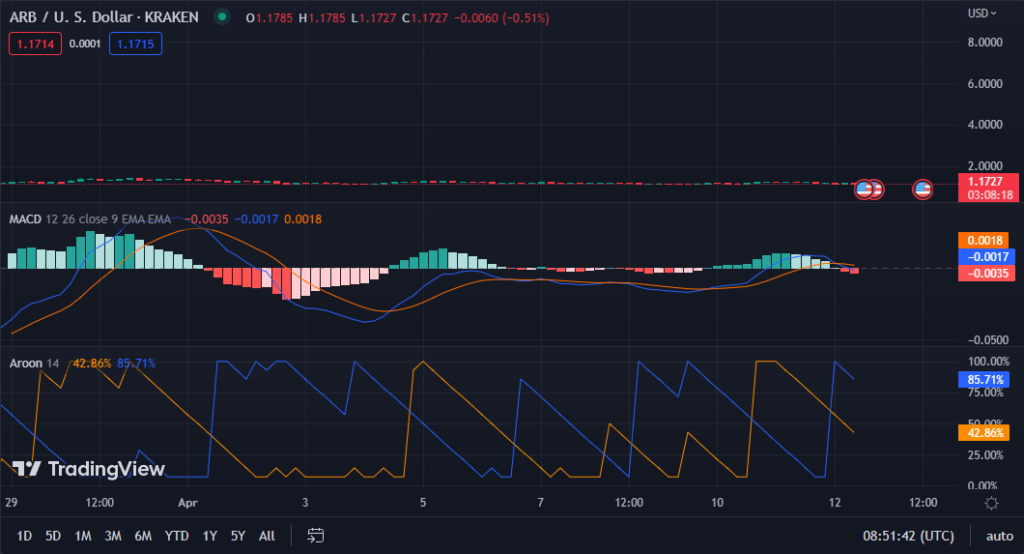
On the 4-hour price chart for ARBUSD, the MACD blue line has made a noteworthy move by dipping below its signal line, currently sitting at -0.0017. This bearish crossing suggests a shift in the short-term trend for ARB/USD, presenting a potential selling opportunity for traders. To mitigate potential losses, traders may consider implementing stop-loss orders, given the negative territory of the MACD.
The MACD histogram has dipped into the negative zone, registering a value of -0.0035, further fueling the bearish sentiment. This downward trajectory indicates that the selling pressure is robust, and the momentum is still unfavorable, hinting at a possible continuation of the downturn shortly.
Based on the current ARB price chart, investors must exercise caution when considering long positions. The Aroon indicator shows a significant 85.71% reading for Aroon down and a 42.86% reading for Aroon up, indicating a strong downtrend in the market. As such, traders should wait for a confirmed trend reversal before establishing new positions. This approach will help mitigate potential losses, as further price decline is possible shortly.

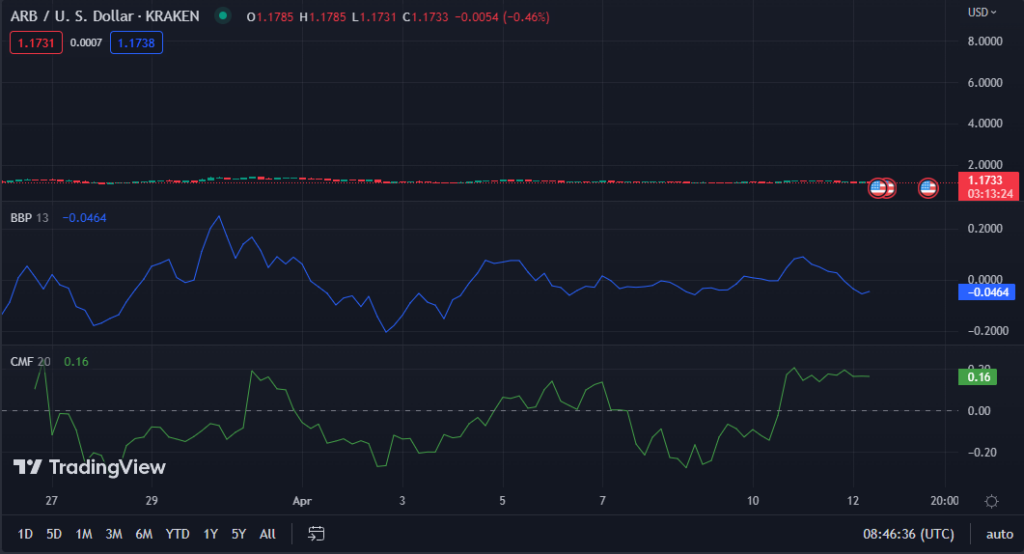
According to the Bull Bear Power score on the ARB/USD price chart, the current market conditions favor the bears. With a score of -0.0449, selling pressure surpasses purchasing demand. This downward trend indicates that traders in the ARB/USD market should contemplate short positions or wait for a potential price reversal before initiating long positions. It’s prudent to stay vigilant and make informed decisions in such a market scenario.
The ARB’s downward trend appears relatively mild, as evidenced by its Chaikin Money Flow score of 0.16. This score suggests that there may be a chance to buy in at a favorable price point. The reason for this optimism is that the CMF level remains above zero, indicating that there is still a demand for purchasing despite the negative momentum. This could lead to a rise in price, making it a promising opportunity for investors.

As ARB encounters a downturn in the market, prudent investors may exercise patience and await a potential shift in the trend. However, those with a more opportunistic mindset may view this as a prime opportunity to capitalize on the current low prices and make a strategic investment.
Disclaimer: The insights, perspectives, and data presented in this price analysis are published in good faith. Readers must conduct their own research due diligence. Any decision made by the reader is solely their responsibility, and Crypto Outlooks shall not be held responsible for any consequential or incidental harm or loss.


