- Digital currencies saw a 0.67% rise in overall market capitalization recently.
- Terra Classic (LUNC) surpassed a crucial price level in the last 48 hours.
- Worldcoin (WLD) broke down from a bearish chart pattern last week.
Numerous digital currencies managed to secure 24-hour profits during the previous trading day. Consequently, the market saw a 0.67% rise in its overall market capitalization, based on data from CoinMarketCap. This minor recovery could prompt investors and traders to seek out potential trading prospects in the market in the upcoming week.
Traders should pay attention to potential trade opportunities offered by Terra Classic
Terra Classic (LUNC)
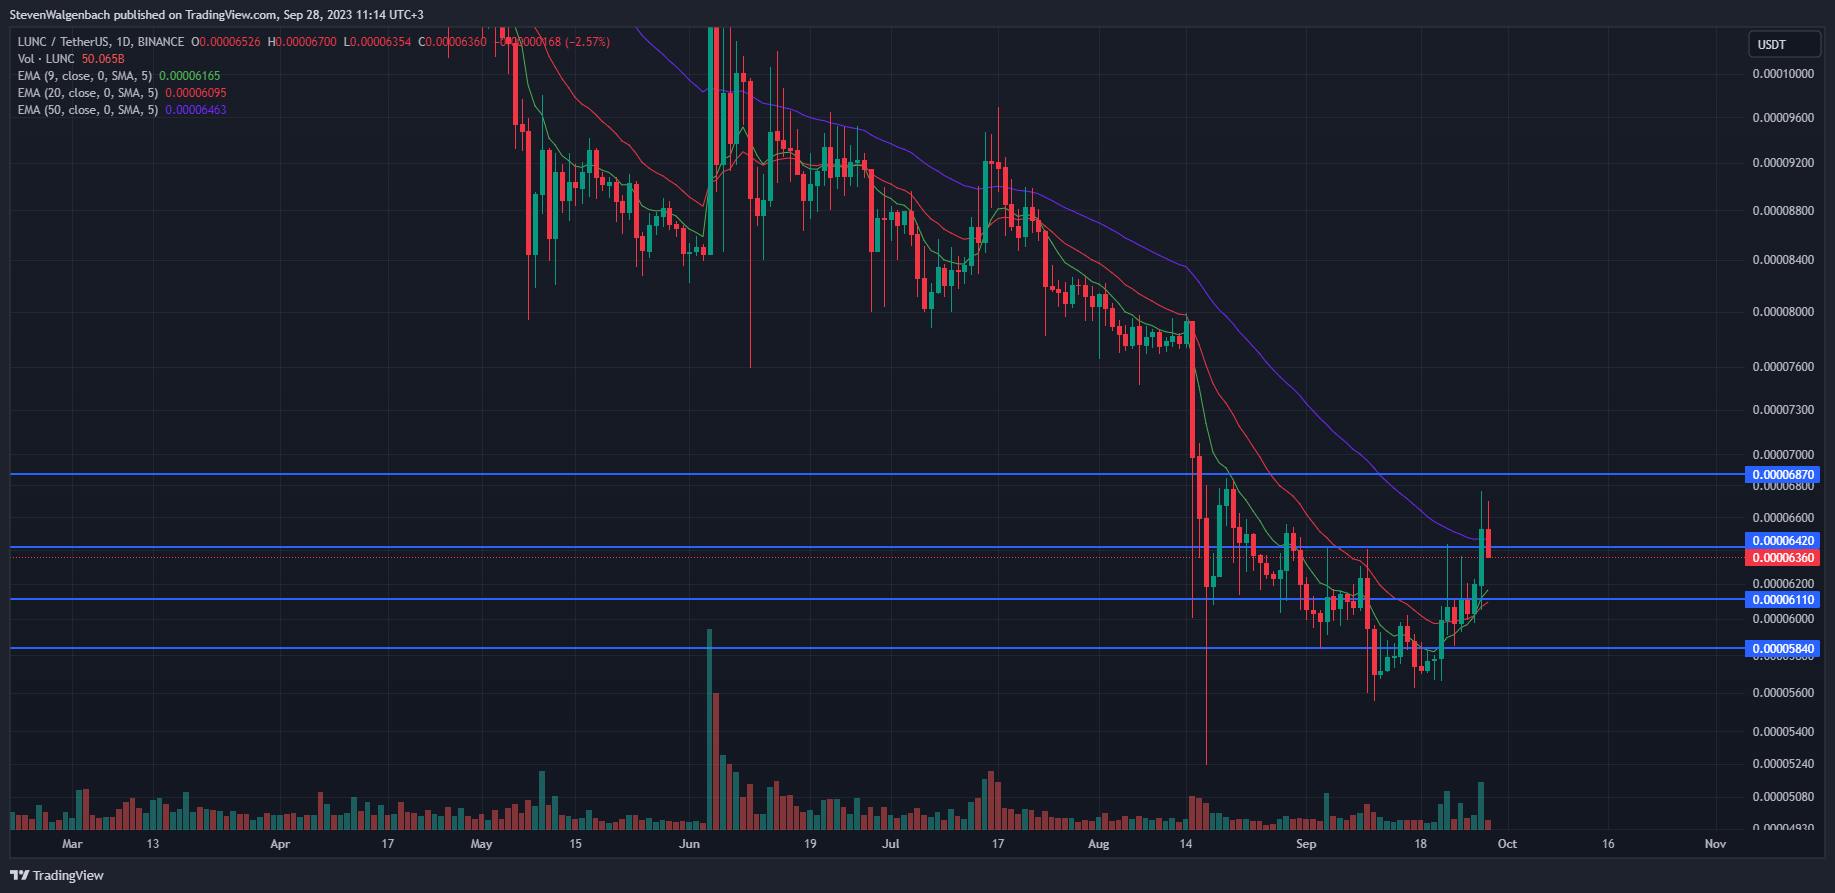
In the last 48 hours, LUNC’s value surpassed a crucial price level, although it has since fallen below this threshold at the time of reporting. However, a significant bullish technical flag has recently been activated on the altcoin’s daily chart, which could potentially increase LUNC’s price in the forthcoming days.

LUNC surpassed the resistance level of $0.00006420 in the last two days. Even though the cryptocurrency price has since fallen below this level, the 9-day Exponential Moving Average (EMA) line has recently moved above the 20-day EMA line. This is a notable bullish technical indicator, implying that the momentum has now swung towards the bulls.
Should the technical flag be confirmed, LUNC could surpass the $0.00006420 threshold and possibly convert this level into support. Given its confluence with the 50-day EMA line, this is a crucial level to monitor. Consequently, a daily candle closing above this price could lay the groundwork for LUNC to approach the subsequent resistance at $0.00006870.
Conversely, if LUNC cannot sustain a daily candle above the current price level in the forthcoming 48 hours, it could negate the bullish outlook. Under these circumstances, LUNC may face rejection at the 50-day EMA line, potentially causing a drop to $0.00006110. Persistent selling pressure could further push the altcoin to a value as low as $0.00005840.
Worldcoin (WLD)
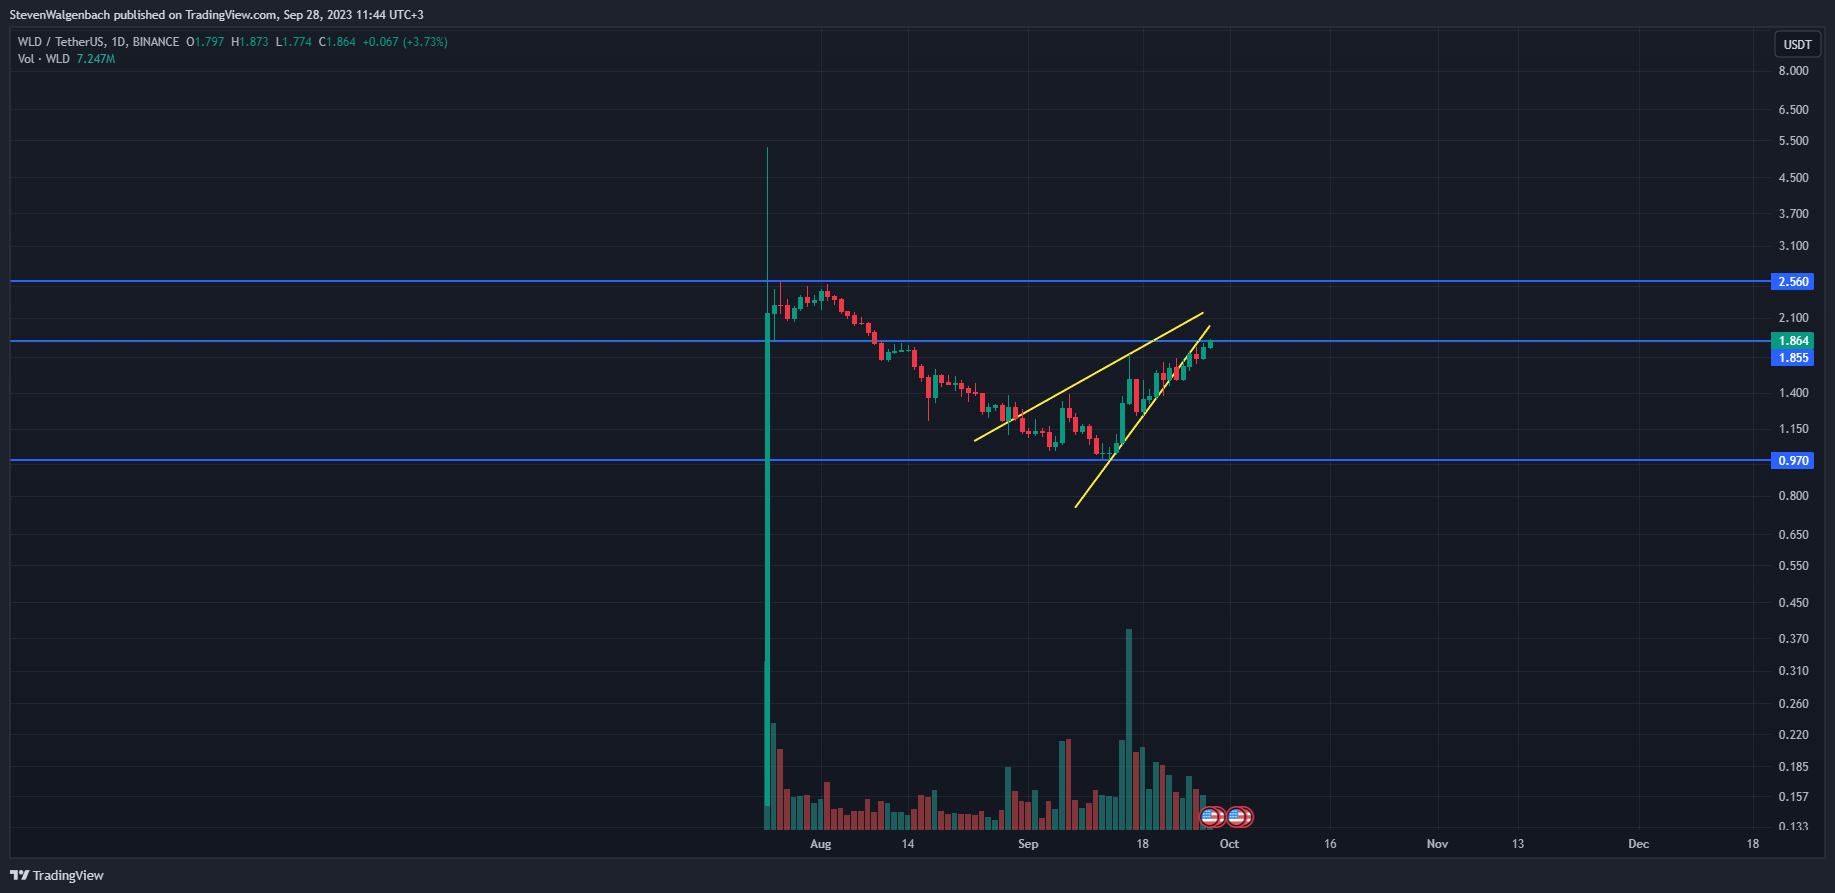
Over the previous week, WLD had broken down from a bearish chart pattern. However, there remained a possibility for the altcoin to nullify this chart pattern, as it was striving to surpass a significant resistance level at the time of reporting.

Over the last few weeks, a bearish rising wedge pattern has been observed on WLD’s daily chart. In the past week, WLD’s price has broken out of this significant chart pattern and is trading outside the rising wedge. If the cryptocurrency does not close the daily candle above $1.855 today, it could confirm the validity of the chart pattern.
In this situation, there is a potential risk of WLD’s value dropping to $0.970 within the next 14 days. On the other hand, if today’s daily candle closes above $1.855, it could nullify the downward trend. As a result, the cryptocurrency’s price could persist in its upward trajectory towards the next major resistance level at $2.560.
Solana (SOL)
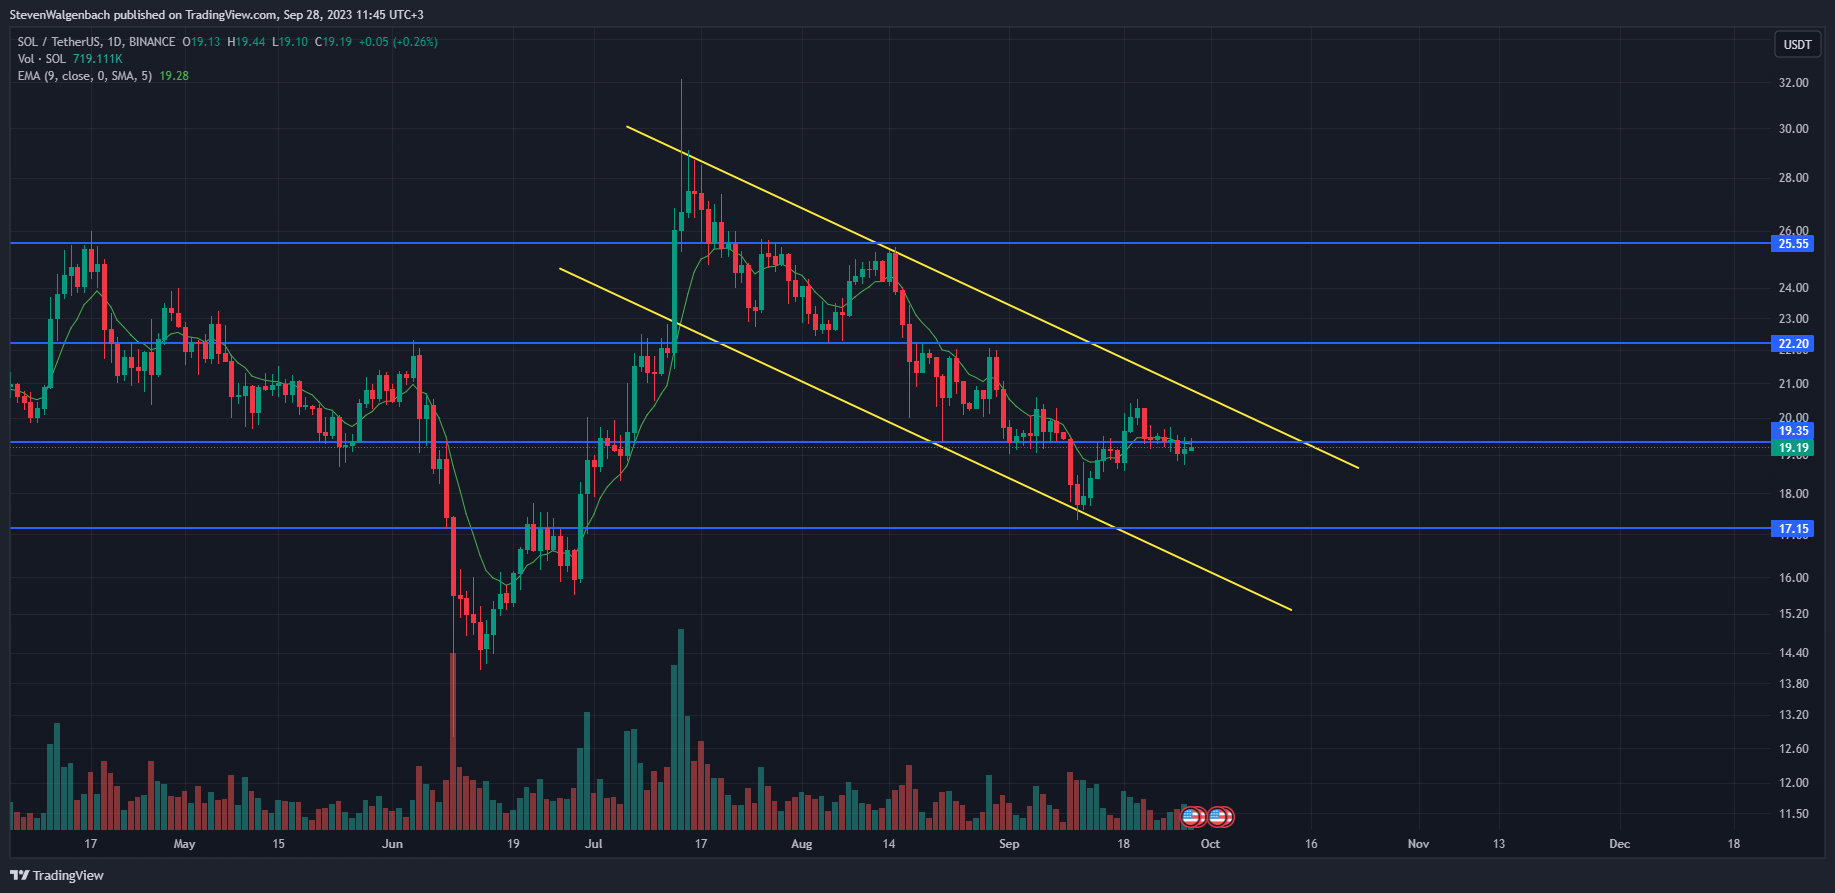
Like WLD, SOL was striving to surpass a significant resistance level at the time of reporting. If it manages to close a daily candle beyond this point, it could proceed to ascend and eventually break free from the medium-term bearish price channel evident on its chart over the recent weeks.

Over the last three days, SOL has fallen below the crucial price point of $19.35 and remained under this level at the reporting time. This price point is significant as it aligns with the 9-day EMA line, which has historically been a robust resistance level for the altcoin’s value. Consequently, if a daily candle closes above this level, the SOL price rise to $22.20 could be triggered.
If the current pace persists, the cryptocurrency price could convert the $22.20 level into a support point before progressing towards $25.55 in the next few days. An early sign of this optimistic scenario would be if the price of SOL surpasses the top boundary of the existing downward price trend.
Conversely, if SOL does not close a daily candle above $19.35 in the upcoming 48 hours, it could trigger a price decline in the following days. Under this pessimistic outlook, the price of the so-called Ethereum-killer might revisit the immediate support level of $17.15.
Loopring (LRC)
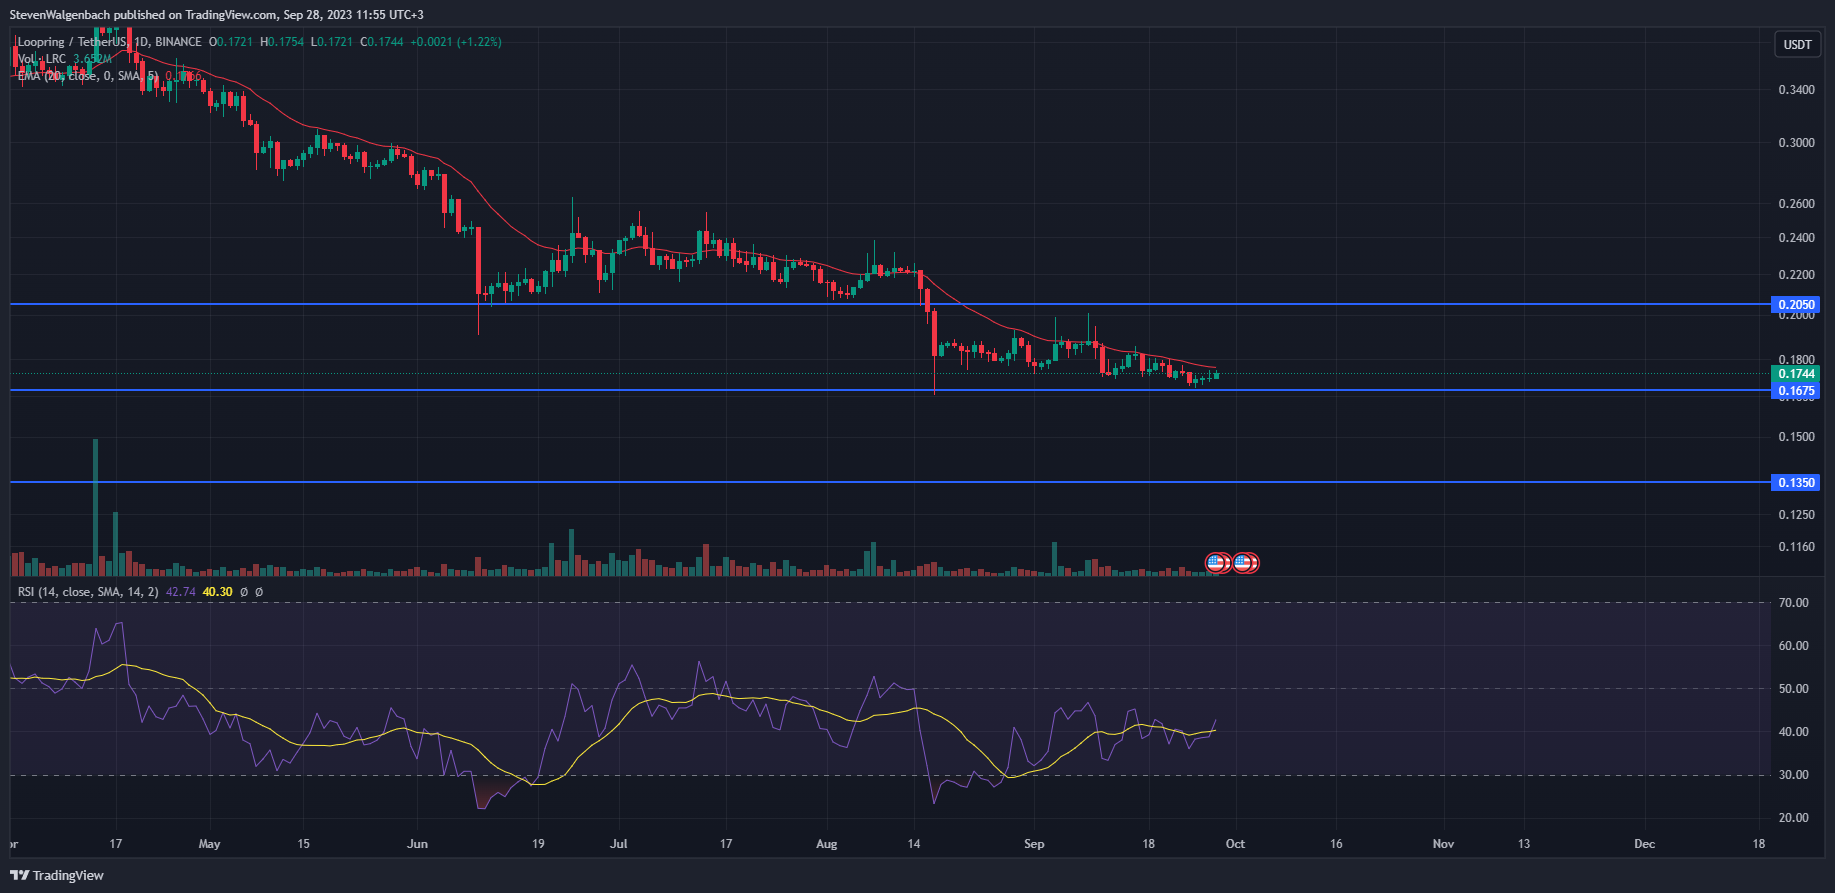
A significant positive technical flag was recently activated on LRC’s daily chart. This indicates that purchasers now have the advantage on the altcoin’s daily chart, which could make it simpler to increase the cryptocurrency’s value in the coming days.

In the last two days, the Relative Strength Index (RSI) line of LRC’s daily chart has moved above the RSI Simple Moving Average (SMA) line on the cryptocurrency’s chart. This specific technical indicator implies that there has been a favorable change in momentum recently. Moreover, it could signal a potential rise in the overall strength of the bullish investors.
Following this, the price of LRC may rise beyond the 20-day EMA line, which was approximately $0.1766 at the time of reporting. If a daily candle closes above this technical benchmark, it could result in the altcoin’s price further escalating to the resistance level of $0.2050 within the subsequent week.
Conversely, if the LRC’s value declined by the 20-day EMA line, it could lead the altcoin to reevaluate the immediate support level at $0.1675. Should traders engage in panic selling at this juncture, LRC’s value could potentially plummet to $0.1350 in the forthcoming days.
Disclaimer: The insights, perspectives, and data presented in this price analysis are published in good faith. Readers must conduct their own research due diligence. Any decision made by the reader is solely their responsibility, and Crypto Outlooks shall not be held responsible for any consequential or incidental harm or loss.


