- The 1inch Network (1INCH) experienced a slowdown, leading to a bearish shift.
- 1INCH’s market cap dipped 0.86%, but trading volume increased by 11.40%.
- Increasing RSI and decreasing selling pressure suggest a near-term recovery for 1INCH.
The upward trajectory of the 1inch Network
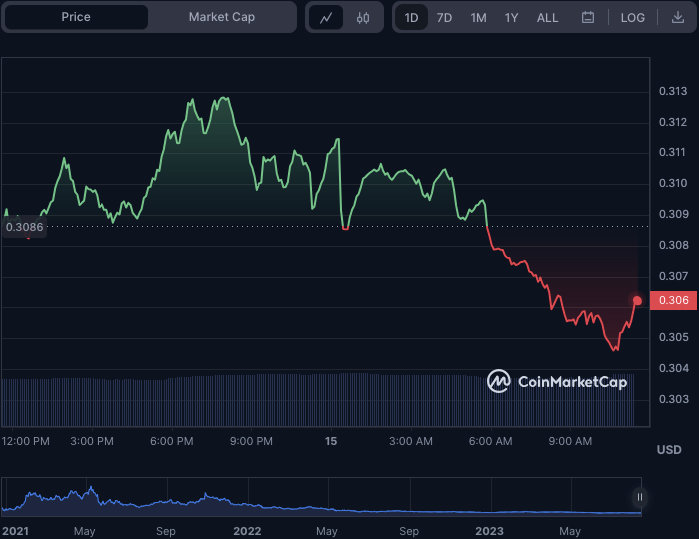
As a result, the 1INCH market was dominated by bearish sentiment, driving the price down to a daily low of $0.3045 until bullish investors intervened to stabilize the market. At the point of reporting, 1INCH was exchanging hands at $0.3063, suggesting a minor recovery from the day’s lowest point.
Amid the downturn, 1INCH’s market cap experienced a 0.86% dip, settling at $315,284,827. However, its 24-hour trading volume saw an uptick of 11.40%, reaching $18,400,820. Despite the depreciation, the surge in trading volume suggests heightened activity and interest within the 1INCH market. This indicates that traders actively participate in the buy-sell process, potentially signaling an imminent market recovery.

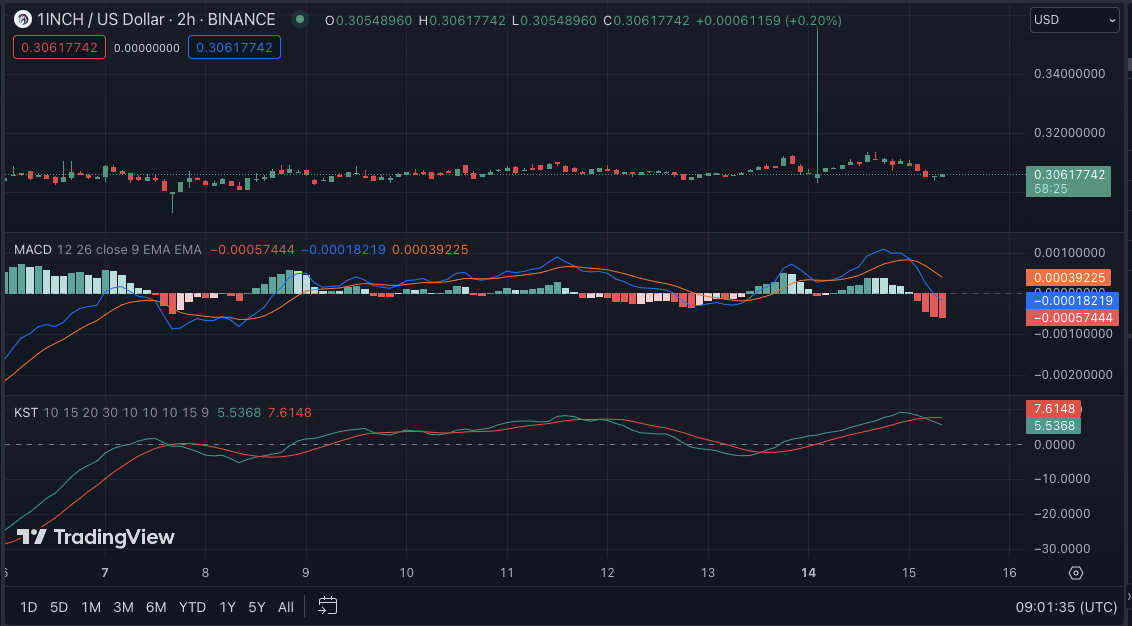
The Moving Average Convergence Divergence (MACD) trend for 1INCH currently stands at -0.00057444, indicating a bearish sentiment in the market. This negative trajectory suggests that the selling pressure outweighs the buying pressure, which could trigger further downward adjustments in the price.
Besides the bearish sentiment, the histogram displayed a series of diminishing bars, indicating a decrease in bullish momentum. This trend suggests that 1INCH could exhibit further downsides.
The Know Sure Thing (KST) indicator for 1INCH has dipped to 5.5368, falling beneath its signal line and intensifying the bearish outlook. The KST, a momentum oscillator, measures the pace of price fluctuations; a reading below the signal line typically indicates a potential reversal towards a downward trend. This trajectory suggests that 1INCH could face increased selling pressure and further price depreciation unless the bulls manage to regain control.

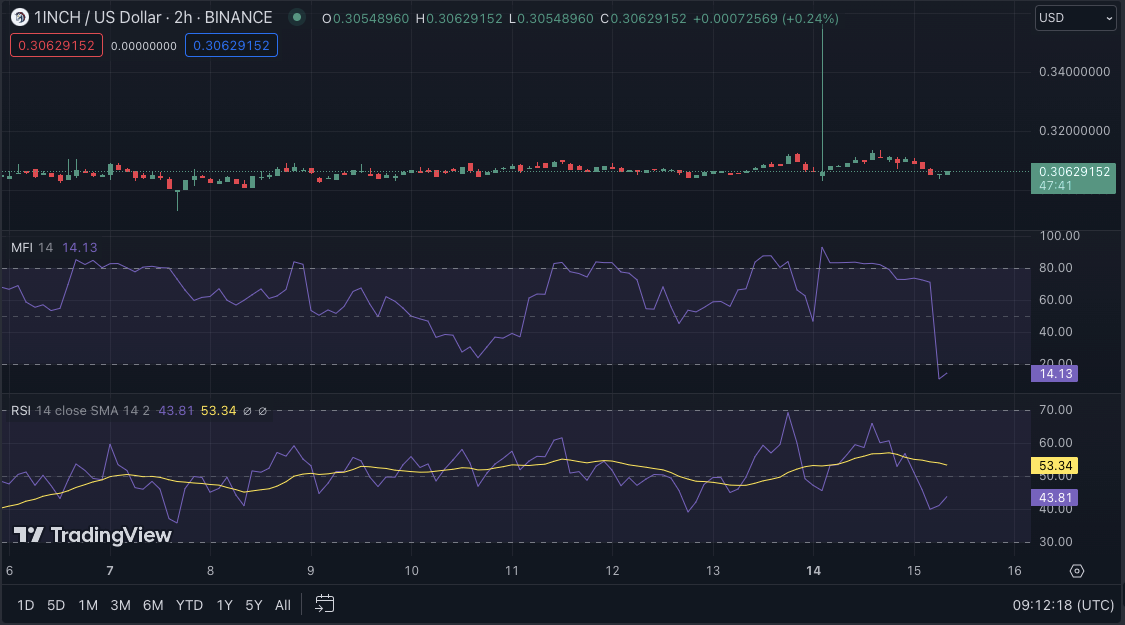
Nonetheless, the Money Flow Index (MFI) score of 14.05 suggests a decrease in the bearish momentum. An MFI below the oversold threshold of 20 could signal a reduction in selling pressure, potentially attracting buyers into the market. This shift could trigger a minor relief rally or price consolidation in 1INCH before any additional downward movement.
The Relative Strength Index (RSI) currently stands at 43.40 and is on an upward trajectory, suggesting a decrease in selling pressure. This uptick in RSI could indicate a shift in market sentiment towards buying, bolstering a short-term price recovery for 1INCH. However, should selling pressure continue and the RSI dips below the 30 mark, it could signal further bearish trends in the market.

To sum up, although 1INCH is grappling with bearish obstacles, the increasing Relative Strength Index (RSI) and decreasing selling pressure suggest the possibility of a near-term recovery.
Disclaimer: The insights, perspectives, and data presented in this price analysis are published in good faith. Readers must conduct their own research due diligence. Any decision made by the reader is solely their responsibility, and Crypto Outlooks shall not be held responsible for any consequential or incidental harm or loss.


