- BTC’s price trajectory shows similarity to bullish cycle from 2013-2017.
- BTC’s current price is $29,030.40, with a 0.58% decline in 24 hours.
- BTC’s market dominance increased to 48.73% despite downward trend.
In a recent tweet, Ali, a prominent cryptocurrency trader, and analyst, pointed out an intriguing similarity between the current price trajectory of Bitcoin (BTC) and the bullish cycle observed from 2013 to 2017. Drawing from historical patterns, Ali suggests that if this trend continues, we may witness a significant price surge for the market-leading cryptocurrency towards the conclusion of this year.
At the time of reporting, CoinMarketCap reflects BTC trading at $29,030.40, registering a 0.58% decline in the last 24 hours. This downward trend has further exacerbated the cryptocurrency’s weekly performance, resulting in a cumulative loss of -1.12%.
Despite experiencing a downward trend in its daily performance, BTC surpassed other cryptocurrencies in the market during the previous trading day. BTC’s market dominance witnessed a notable increase of 0.02% within the last 24 hours, elevating its dominance to 48.73% at the time of this report.

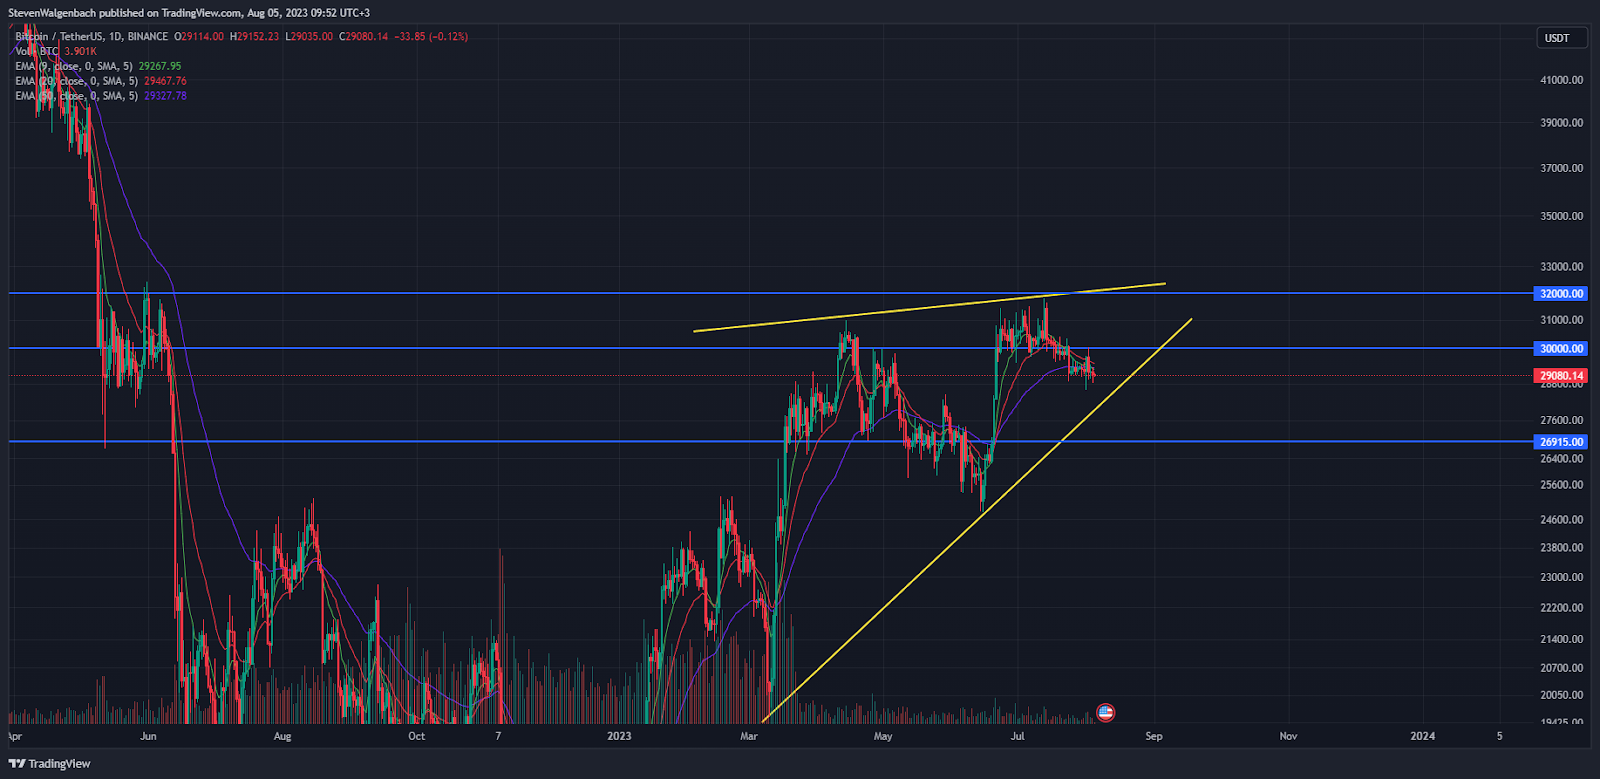
From a technical perspective, BTC’s daily chart exhibited a bearish rising wedge pattern, indicating a potential downward breakout in the upcoming week. Should this pattern be confirmed, BTC’s price will likely decline to approximately $26,915 within the next few days.
Nevertheless, it is anticipated that the dominant player in the market will try to surpass the significant psychological threshold of $30,000 in the coming 24-48 hours. If there is sustained buying activity, this could propel the price of Bitcoin (BTC) towards the subsequent significant resistance level at $32,000.
It is important to observe that the 9-day Exponential Moving Average (EMA) line recently crossed below the 20-day EMA line, indicating a short-term bearish trend for BTC. Consequently, the price will continue to decline in the coming days. Furthermore, within the last 48 hours, the 9-day EMA line has also breached the 50-day EMA line, reinforcing the bearish sentiment.
If the 20-day exponential moving average (EMA) line on the chart of the leading cryptocurrency experiences a decline below the 50-day EMA line, it could confirm a bearish outlook and validate the observed chart pattern. Under such circumstances, the price of Bitcoin
Disclaimer: The insights, perspectives, and data presented in this price analysis are published in good faith. Readers must conduct their own research due diligence. Any decision made by the reader is solely their responsibility, and Crypto Outlooks shall not be held responsible for any consequential or incidental harm or loss.


