- Bitcoin price surpasses $66,000, reaching a high not seen since March.
- U.S. CPI data release contributes to Bitcoin breaking $64,000 resistance level.
- Analysts predict bullish trend as Bitcoin targets $70,000 with positive technical indicators.
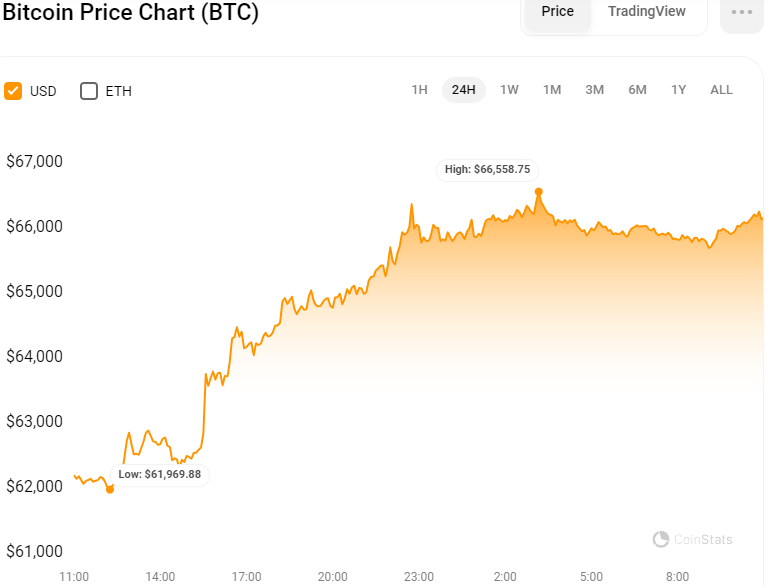
On Thursday, Bitcoin’s price increased by 6%, exceeding $66,000 for the first time since March. At the time of reporting, its price is $66,225.85, and its market capitalization is $1.295 trillion. Similarly, its trading volume has experienced a 76.00% increase, reaching $42.575 billion.

The increase occurred subsequent to the latest release of the U.S. Consumer Price Index (CPI) data on Wednesday. Bitcoin
Market analysts are indicating that the downward trend may be concluding
Rekt Capital, a firm specializing in cryptocurrency analysis, has indicated that the recent surge may be a sign that Bitcoin’s downward trend is approaching its conclusion. The firm has observed that markets frequently challenge investors’ determination with declines prior to the realization of substantial gains.
“The Bitcoin bull market is not over,” Rekt Capital remarked.“
Moreover, Bitcoin is exhibiting indications of diminished selling pressure, beginning to show stability around the $60,000 support mark. This consistent support is crucial for the maintenance of the ongoing bullish trend.
A well-regarded financial analyst, Peter Brandt, has also expressed a positive outlook on Bitcoin’s future direction. Brandt indicates that Bitcoin is on course to reach unprecedented high levels. However, for Bitcoin to achieve this, it must surpass the $67,000 threshold with a definitive upward movement and robust buying momentum.
Bitcoin Targets $70,000
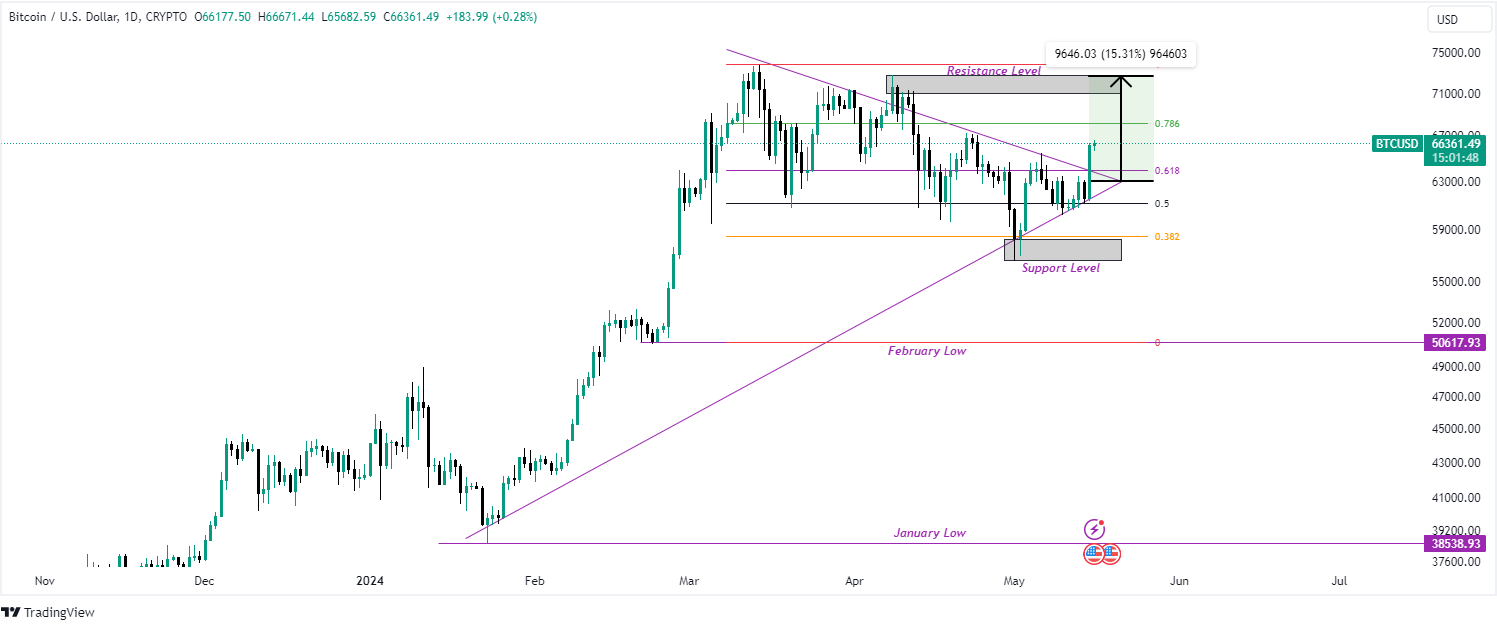
The path of Bitcoin appears to be on an encouraging rise as it emerges from a symmetrical triangle pattern on the daily chart with an upward breakout. This positive trend could drive Bitcoin’s value toward the $70,000 level if the current positive market sentiment continues. Conversely, if the market sentiment turns negative, Bitcoin could find itself seeking lower support around the $58,000 level.

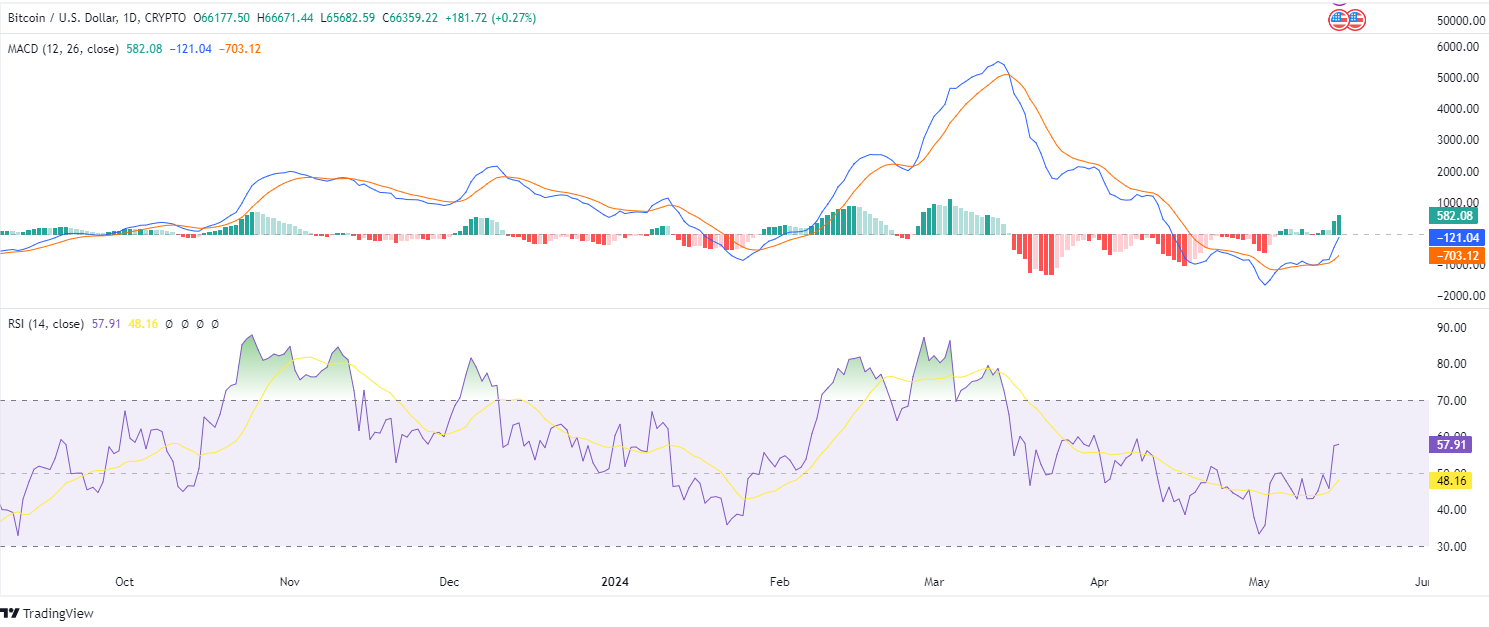
The MACD (Moving Average Convergence Divergence) indicator supports a bullish perspective as it exhibits an upward trajectory. Such an ascent signals a persistent positive market sentiment. Currently, at a value of -121.04, the MACD line is approaching the zero mark, which implies that the bullish trend may persist shortly.
Additionally, the bullish trend is corroborated by the expanding green bars on the MACD histogram positioned above the zero line. This configuration usually signifies intensifying bullish activity, suggesting ongoing buyer demand and the possibility of continued upward movement in prices.

The Relative Strength Index (RSI), another important technical metric, reflects this optimistic outlook. The RSI curve is rising steeply and currently sits at 57.91. Additionally, it is well above the signal line and remains outside the overbought zone, indicating that there is significant potential for expansion before the market reaches an overextended state.
Disclaimer: The insights, perspectives, and data presented in this price analysis are published in good faith. Readers must conduct their own research due diligence. Any decision made by the reader is solely their responsibility, and Crypto Outlooks shall not be held responsible for any consequential or incidental harm or loss.


