In the wake of recent financial institution crashes, the crypto world has emerged as a prominent player. While some digital coins remain dormant, a few cryptocurrencies have demonstrated impressive performance over the past week.
Discover the top-performing tokens of the week and the driving factors behind their triumph. Expand your knowledge by delving into the details.
Mask Network (MASK)
MASK has secured the top spot as the highest-performing coin, boasting an impressive surge of 45.56% in just seven days. Currently priced at $6.24, this cryptocurrency has a market cap of $474,514,314 and has experienced a notable hike of 17.78% in just one day. The trading volume of MASK is valued at $360,773,409, with a sudden 70% increase in just 24 hours, indicating strong interest from traders. These impressive figures demonstrate the potential of MASK as a valuable investment opportunity.
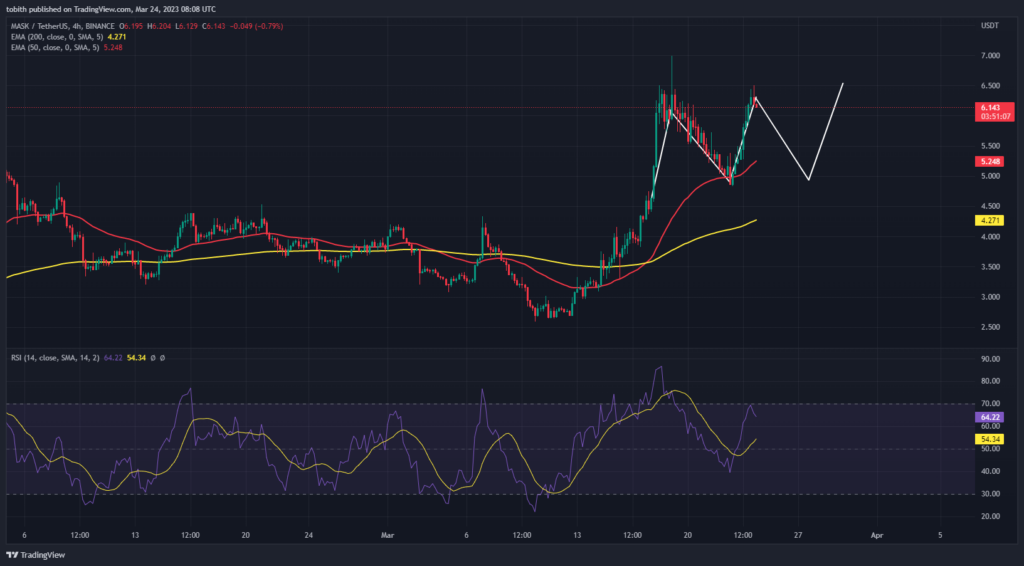
Upon analyzing the 4-hour chart, it is evident that MASK is bullish, with its candlesticks soaring above the EMA indicators. The recent formation of a golden cross between the 50EMA and 200EMA has further fueled the upward momentum, attracting buyers to the market. As a result, MASK’s popularity has skyrocketed, propelling its price to new heights. However, traders remain cautious about the upcoming week, with uncertainty looming.
The price action of MASK is exhibiting a discernible pattern, yet predicting its momentum without confirmation remains challenging. There is a potential for a double-top formation, but this could be invalidated if a double-bottom emerges. Notably, the gap between the 200MA and the 50MA widens, indicating the likelihood of a double bottom formation and a subsequent price increase. As such, traders must diligently monitor the price patterns and indicators to make informed decisions.
XRP (XRP)
Ripple Lab’s native token, XRP, has made a noteworthy entrance into the market, demonstrating its position as one of the top-performing coins this week. Despite its tendency to move sideways, XRP experienced an unexpected surge, currently priced at $0.4265, with a 14.51% increase over the past seven days. However, it faced a 3.75% decline in the last 24 hours. Additionally, the trading volume has decreased by 41.40% to $1,722,409,614, indicating a settling demand for XRP.
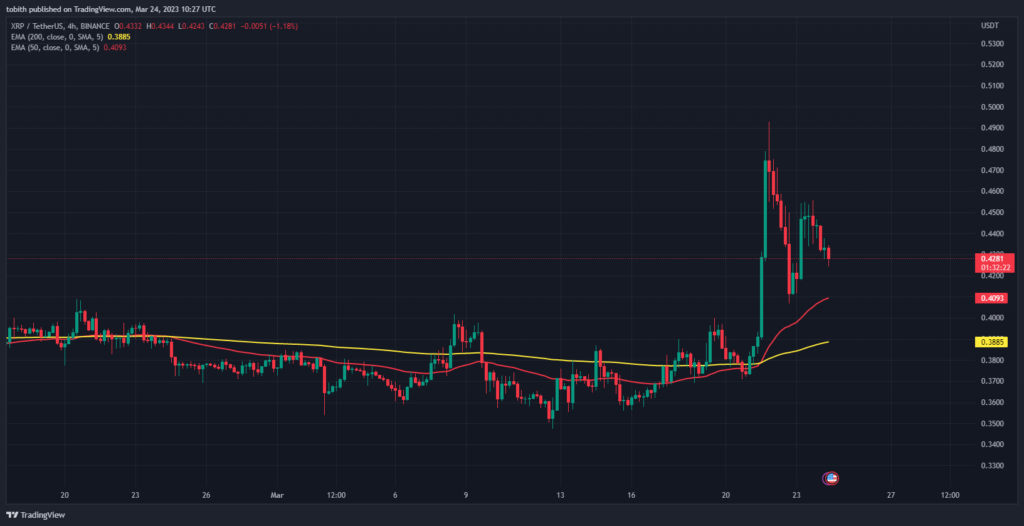
According to the 4-hour chart analysis, XRP had been lingering below the 200EMA and 50EMA. However, on Tuesday, XRP experienced a remarkable surge of 26.89%. This breakthrough was a significant milestone for XRP, which had been stagnant for an extended period, unable to surpass the $0.4 resistance level. After peaking at 0.4745, the price subsequently dropped to $0.4065. Since then, the price has grappled to maintain its position above the $0.4 resistance level.
Upon analyzing XRP’s recent market performance, it is evident that a golden cross has formed between the 50EMA and the 200EMA. This development has confirmed that XRP is poised to run with the bulls. However, it is important to note that the gaps between these indicators gradually narrow, signaling that the bull run may soon end. As such, traders are advised to exercise caution when monitoring XRP’s price movements. There is a possibility that XRP may experience a pullback to its support level and continue to move sideways for some time. It is crucial to remain vigilant and informed to make informed trading decisions.
Litecoin (LTC)
Litecoin has returned triumphantly to the top-performing coins list, boasting an impressive surge of 13.36% in just one week. Currently priced at $92.87, LTC’s market cap stands at $6,737,193,994, with a modest 4.61% increase in the last 24 hours. Despite a 12.19% drop in trading volume over the same period, Litecoin’s recent performance is a testament to its resilience and potential for growth. While traders’ demand for Litecoin may have reduced slightly, its impressive gains this week clearly indicate its enduring appeal to investors.
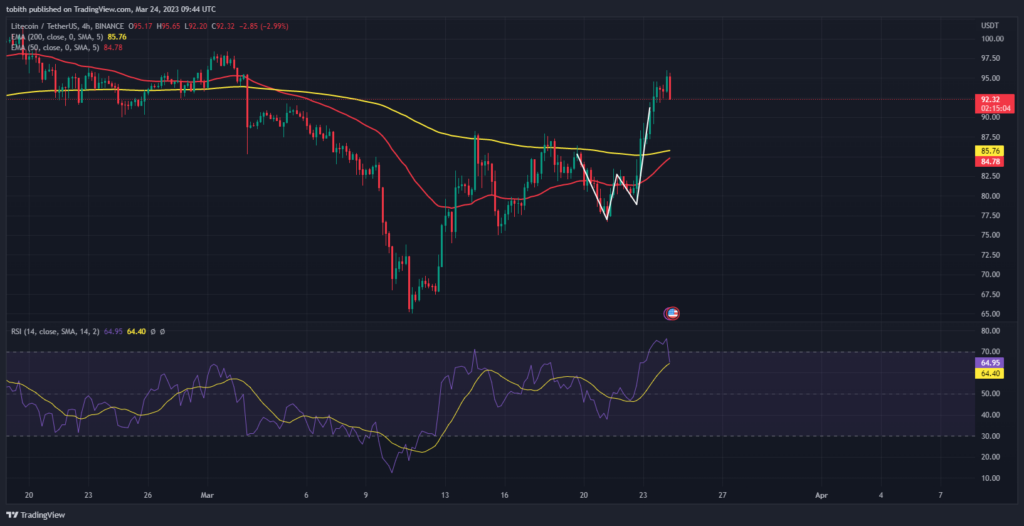
Upon analyzing the 4-hour chart, it is evident that LTC is experiencing an upward trend, with prices surpassing both the 200 EMA and 50 EMA. While the 200 EMA is positioned above the 50 EMA, typically indicating a bearish market, the gap between these indicators gradually decreases. Should the MA indicators intersect and form a golden cross, this confirms that LTC will continue to thrive amongst bullish investors for the foreseeable future.
Furthermore, the Relative Strength Index (RSI) currently stands at 64.27, signifying a robust trend for LTC as buyers persist in demonstrating demand and entering the market. Nevertheless, the RSI’s trajectory points downwards, suggesting a potential deviation from the overbought territory. Traders commonly believe that the 50 to 70 range is the optimal zone, anticipating a further price increase. However, traders must exercise caution as the trend could shift.
Cardano (ADA)
ADA has made a remarkable entry into the league of top-performing coins, exhibiting an impressive performance this week. Currently valued at $0.3617, ADA has witnessed a surge of 5.95% in just seven days. Despite a slight dip of 2.66% in its market cap, which stands at $12,576,730,244, ADA continues to hold its ground. However, like XRP, traders’ interest in ADA is waning, as the trading volume has plummeted by 38.26% to $377,078,995 in the last 24 hours.
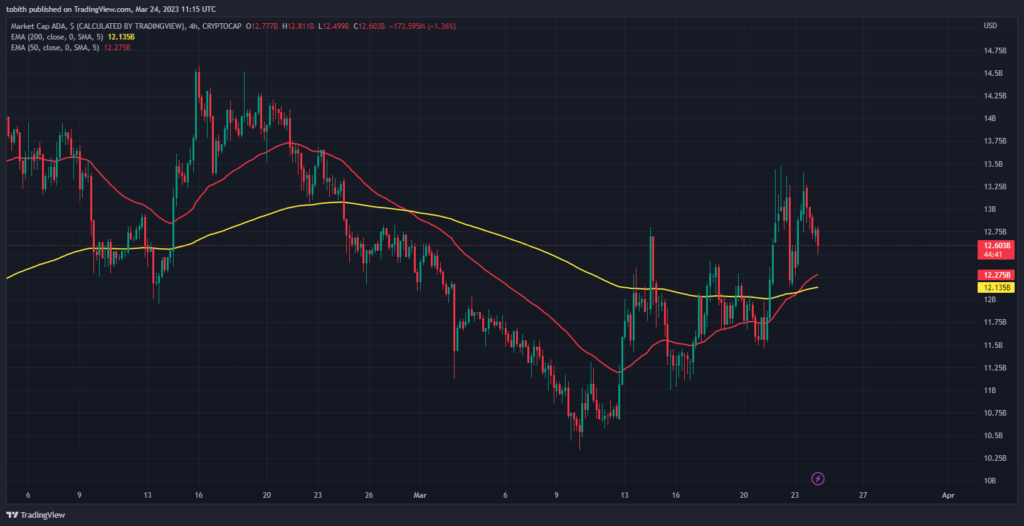
According to the 4-hour charts, there are promising signs that ADA may experience a bullish surge shortly. This is due to the recent crossing of the 50 EMA and the 200 EMA, which resulted in a golden cross formation. Additionally, the price is above the indicator, further supporting the notion that ADA’s sentiment is bearish. These indicators suggest that investors should closely monitor ADA and consider potential investment opportunities.
ADA exhibits a double-top pattern upon analyzing the candlesticks, indicating a potential downward trend. Interestingly, ADA formed a golden cross in the middle of the week, setting it apart from other high-performing coins. The gap between the indicators is also expanding, making it crucial for traders to monitor the indicators closely and await confirmation of whether the price will continue to favor bulls or bears. It is imperative to exercise caution and remain vigilant in this ever-changing market.
Wrapped Bitcoin (WBTC)
Wrapped Bitcoin is a digitized rendition of Bitcoin (BTC) that operates on the Ethereum (ETH) blockchain, effectively tokenizing the world’s most popular cryptocurrency.
WBTC adheres to the ERC-20 standard, which is the fundamental compatibility benchmark of the Ethereum blockchain. This enables seamless integration into Ethereum’s decentralized exchange, crypto lending services, prediction markets, and other DeFi applications that support ERC-20.
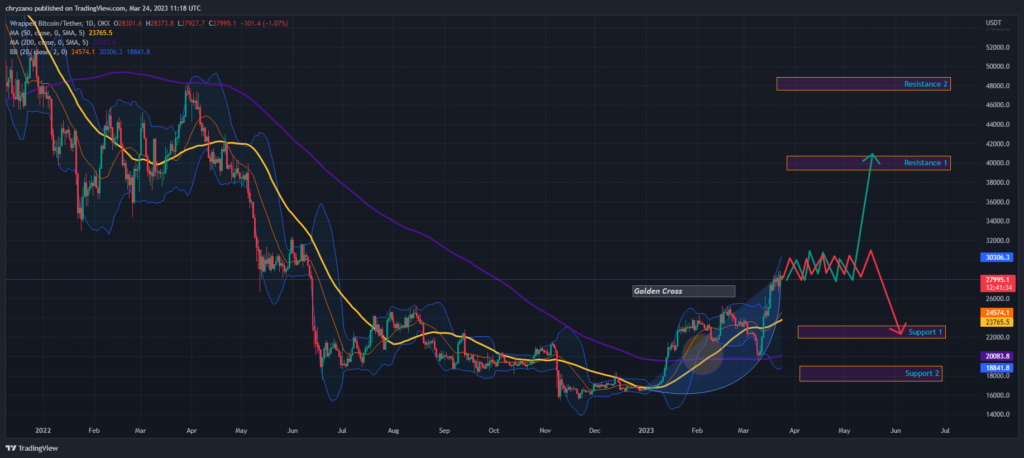
Upon analyzing the chart presented, it becomes apparent that WBTC underwent a significant event known as the Golden cross. This phenomenon occurred when the 50-day moving average intersected the 200-day moving average from below. Should WBTC continue its exponential ascent, it may encounter Resistance 1 at approximately $40,000. However, it is worth noting that while the Golden cross did result in a sudden price surge, it was unfortunately short-lived.
Following a brief surge, prices experienced a dip, but WBTC was fortunate enough to find support from the 200-day MA, preventing a further plummet. Subsequently, WBTC experienced an almost exponential rise after bouncing back from the 200-day MA.
The Relative Strength Index (RSI) currently stands at 66.74 and shows a downward tilt toward the signal. A bearish trend may be on the horizon if it dips below the signal. Conversely, if the RSI climbs towards the overbought region, above 70, we can anticipate a market correction in price. These indicators provide valuable insights for informed decision-making in the financial realm.
Furthermore, the Bollinger bands corroborate the hypothesis above. This is because WBTC has reached the upper Bollinger band, indicating a potential decline in price. Additionally, the expanding bands indicate an increase in volatility shortly. Should WBTC experience a drop, it may find support around the $22,500 mark.
Stacks (STX)
Stacks represents a revolutionary Bitcoin Layer that empowers smart contracts and decentralized applications to leverage Bitcoin as an asset and execute transactions on the blockchain. With Stacks, the possibilities for smart contract functionality are endless, as it seamlessly integrates with the Bitcoin network to provide a secure and reliable platform for decentralized innovation. By utilizing Stacks, developers can unlock the full potential of Bitcoin and create innovative solutions that drive the future of decentralized finance.
Upon analyzing the daily chart for Stacks (STX), it is evident that the coin is experiencing an upward trend following a Golden cross. This pattern was observed in May and June 2022 when STX underwent a similar Golden cross. STX is exhibiting fluctuations while adhering to the same pattern observed earlier. This prompts us to ponder whether STX is replicating its past behavior.
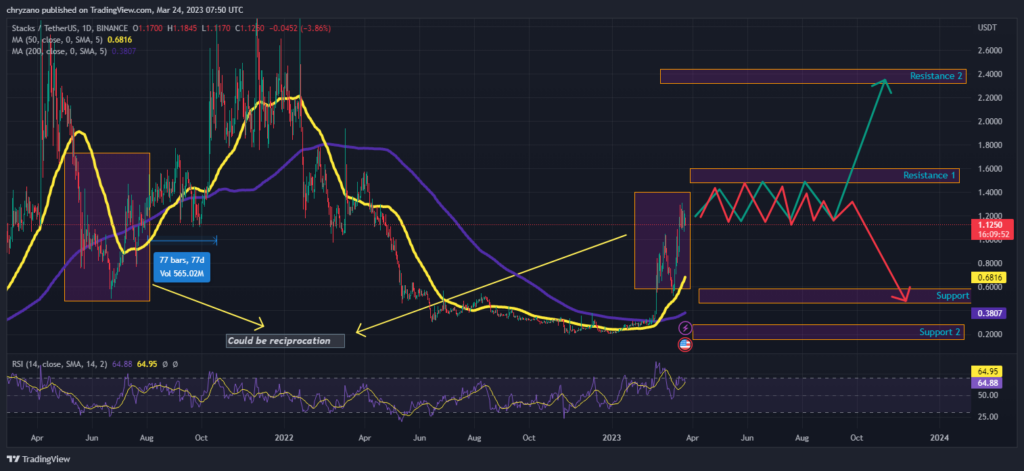
Based on STX’s past patterns, it is plausible to anticipate a breakout above Resistance 1 (approximately $1.5) and a subsequent climb toward Resistance 2 (around $2.4). This projection is grounded in historical data and serves as a professional assessment of STX’s potential trajectory.
Based on the chart, STX required approximately 77 days to reach resistance 2. The question now arises as to whether Stacks will follow a similar trajectory and experience a surge in the same amount of time.
Contrarily, the Relative Strength Index (RSI) currently stands at 64.50, albeit with a downward tilt. Should the RSI fail to breach the overbought territory, STX may encounter resistance 2. However, if it does, STX could undergo a period of consolidation. If the bears seize market control, STX may find support at level one.
In the realm of possibilities, it is worth considering the potential for the 50-day MA and the 200-day MA to intersect with STX in the event of a decline. However, it is important to note that if the bears prove too formidable, STX may breach these two critical lines very well.
Neo (NEO)
Neo presents itself as a dynamic and evolving ecosystem with a clear mission: to serve as the bedrock for the future of the internet. Its vision is to create a novel economy where digital payments, identities, and assets converge seamlessly. With a focus on growth and development, Neo is poised to lead toward a more interconnected and efficient digital landscape.
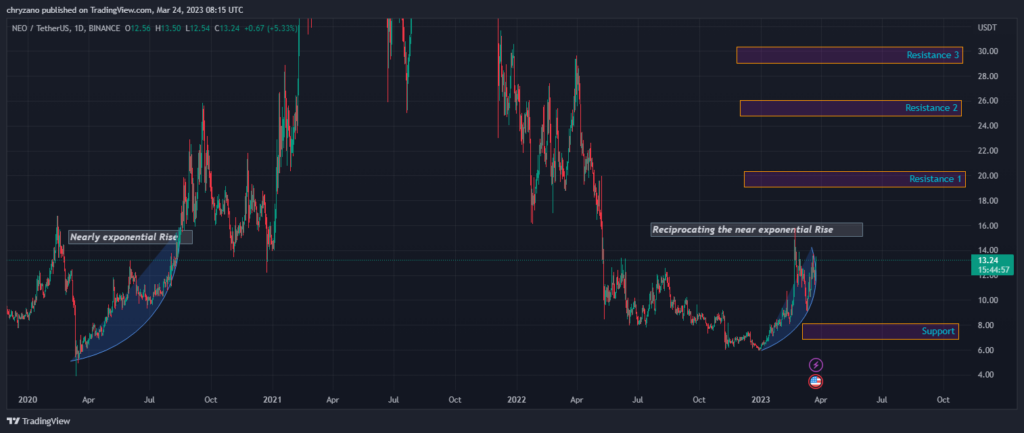
The chart above shows that NEO has been on a steady upward trajectory since late 2022, exhibiting a near-exponential increase in higher lows. This pattern of behavior is reminiscent of the period between April and October 2022, where NEO displayed a similar trend. Considering this as a potential reciprocation of its past behavior is plausible.
Based on our analysis, it is reasonable to anticipate that the prices of NEO will ascend to resistance 2, hovering around the $25 mark. However, it is important to note that the bulls must first overcome resistance 1 to reach this level. It is also plausible that NEO may encounter resistance at this point, resulting in a temporary period of consolidation between resistance one and its current price range. As always, it is crucial to remain vigilant and monitor market trends closely.
If NEO encounters resistance at level 2, there exists a potential scenario where it may experience a decline toward the support level of approximately $7.5.
Nexo (NEXO)
Nexo is a revolutionary lending platform that leverages blockchain technology to provide users with lightning-fast cryptocurrency-backed loans. The project was unveiled in December 2017 and officially launched in April 2018, spearheaded by a team of seasoned finance professionals and passionate crypto aficionados. With Nexo, borrowers can access funds in a snap, while lenders can enjoy peace of mind with a secure and transparent lending process. Join the future of lending with Nexo today.
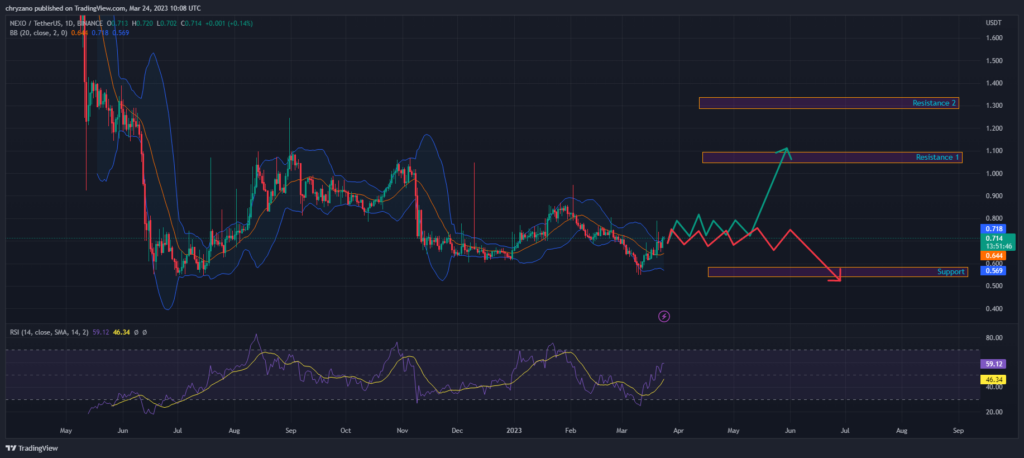
Upon analyzing the chart, it is evident that Nexo has been experiencing a bullish trend since March. If this trend persists, NEXO may reach resistance one at approximately $1.1. However, it is important to note that the Bollinger bands do not align with this optimistic outlook. NEXO has recently touched the upper Bollinger band, indicating an impending correction. Therefore, a correction may occur, leading to a decrease in the price of Nexo.
Furthermore, the current RSI reading of 59.28 indicates a robust trend, with the RSI line running parallel to the horizontal axis. Nevertheless, caution should be exercised if the RSI enters the overbought territory above 70, as this could trigger a market correction. In such a scenario, the bulls may seize the opportunity to take control, potentially causing NEXO to plummet to its support level of ($0.5). It is imperative to remain vigilant and monitor the market closely to make informed investment decisions.
Conclusion
Several cryptocurrencies mentioned earlier have already formed a golden cross, indicating an imminent uptrend in the coming days. Surprisingly, XRP, which had been moving sideways for a while, also made it to the list. Top-ranking coins such as LTC and ADA have also shown bullish signs. However, traders must exercise caution as there is always a possibility of a trend reversal in the future.
Disclaimer: The insights, perspectives, and data presented in this price analysis are published in good faith. Readers must conduct their own research due diligence. Any decision made by the reader is solely their responsibility, and Crypto Outlooks shall not be held responsible for any consequential or incidental harm or loss.


