- Trust Wallet Token (TWT) experienced a pullback, with bearish forces dominating.
- TWT’s market cap decreased by 1.49%, settling at $378,171,358.
- The Relative Strength Index suggests a potential bullish reversal for TWT.
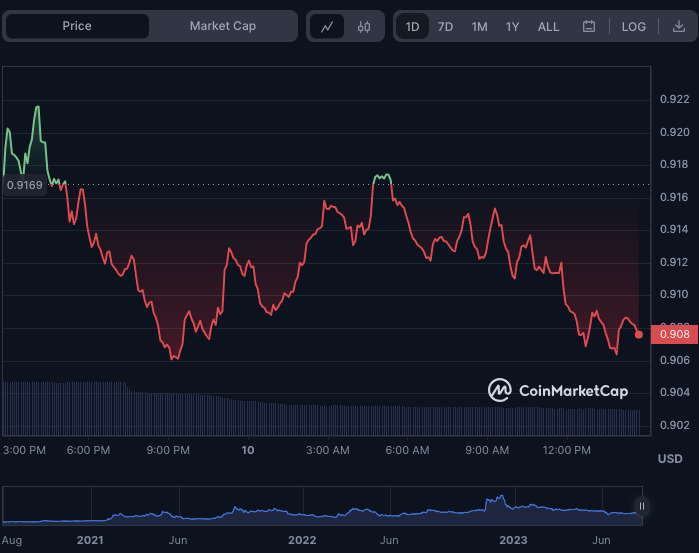
Following an unsuccessful attempt to surpass the resistance level of $0.9231, the bullish momentum for Trust Wallet Token
This support level has remained robust, suggesting possible purchasing enthusiasm at this price level. Nonetheless, additional consolidation or a dip below this level could signal that the TWT market may continue to exhibit a bearish trend.
At the time of reporting, TWT was valued at $0.9076, suggesting a minor rebound from its recent downturn. The prevailing price suggests that investors are intervening to curb any additional depreciation.
TWT’s market cap experienced a 1.49% decrease, settling at $378,171,358, while its 24-hour trading volume saw a more significant drop of 52.72%, landing at $4,458,053. This suggests a decline in TWT market trading activity. The recent dip in price could be the reason behind this reduced activity, as market participants may be exercising caution.

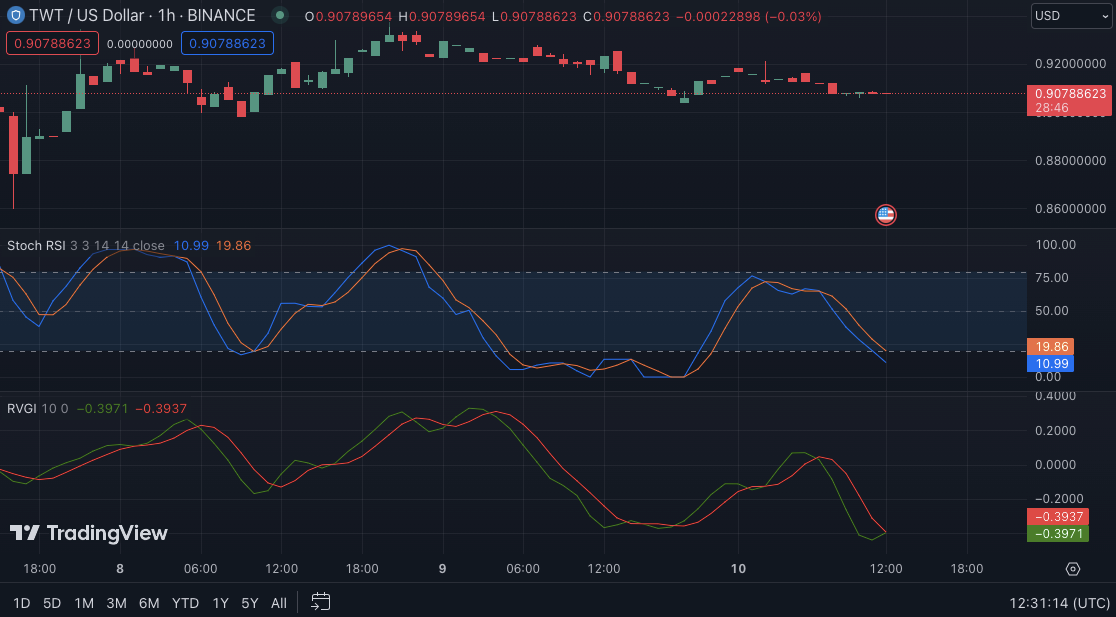
The Stochastic RSI for TWT on the price graph is currently situated in the oversold territory, registering a value of 10.99. This suggests that the TWT token might be undervalued, potentially setting the stage for a price rebound. Often, such oversold scenarios provide lucrative entry points for investors to capitalize on subsequent price appreciations.
When integrated with the stochastic RSI, the Relative Vigor Index (RVGI) can offer supplementary validation of a prospective price reversal. Should the RVGI display a bullish divergence or commence an ascent from oversold positions, it may suggest an amplification in buying pressure, thereby bolstering the likelihood of a TWT token price surge. This is a professional perspective from the cryptocurrency sector.
Consequently, the RVGI indicating a positive direction on the TWTUSD price chart, with a value of -0.3971 as it attempts to exceed its signal line, implies a potential upward shift in momentum.

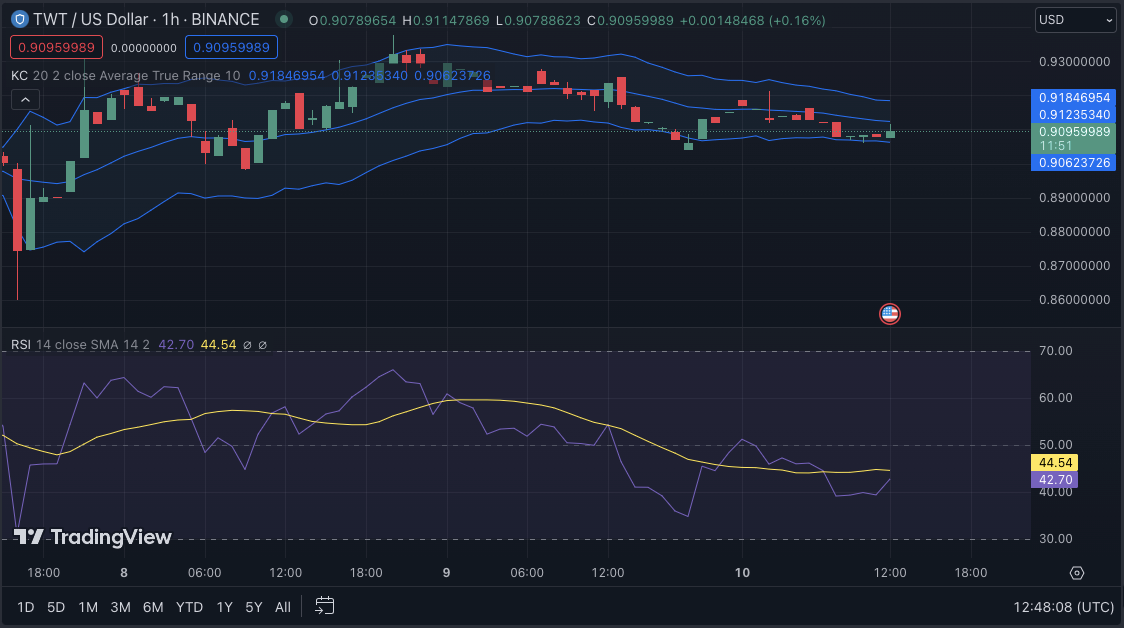
The Keltner Channel bands exhibit linear movement, with the upper band intersecting at 0.91864847, the median band at 0.91253233, and the lower band at 0.90601619. This trend indicates a phase of market consolidation, hinting at an imminent breakout shortly.
The market activity has also rebounded from the lower Bollinger band, culminating in a bullish candlestick. This enhances the potential for a positive price trend.
The Relative Strength Index (RSI) has registered a reading of 42.70, indicating a positive shift towards its signal line and reinforcing the perception of a bullish trend. This movement implies an escalation in buying pressure, suggesting the market is gearing up for an upward trajectory. Should the RSI persist in its upward momentum, surpassing its signal line and breaching the 50 mark, it would solidify the bullish sentiment and heighten the probability of a breakout.

In summary, the price of TWT remains stable following a pullback, indicating a potential for a bullish reversal as signs point towards a surge in buying pressure.
Disclaimer: The insights, perspectives, and data presented in this price analysis are published in good faith. Readers must conduct their own research due diligence. Any decision made by the reader is solely their responsibility, and Crypto Outlooks shall not be held responsible for any consequential or incidental harm or loss.


