- ARB market experiences downward trend following unsuccessful resistance level attempt.
- Bullish sentiment returns as ARB price reaches 24-hour peak.
- Surge in trading volume suggests continued interest in the Arbitrum market.
Over the past 24 hours, the Arbitrum
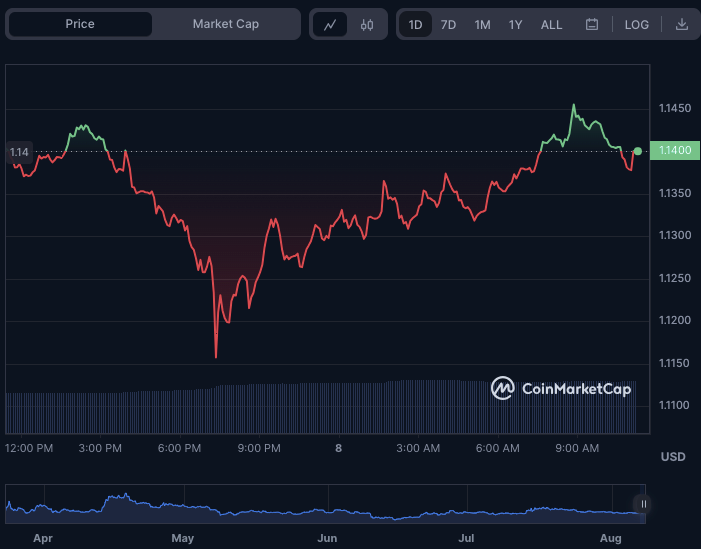
Nevertheless, the market has exhibited signs of recovery as bullish investors swiftly entered the scene, eagerly purchasing at the support level. This surge in bullish sentiment propelled the ARB price to reach a 24-hour peak of $1.15, successfully regaining a portion of the previously lost market value.
The surge in buying pressure suggests a potential bullish trend in the Arbitrum market, as traders eagerly anticipate further upward movement. Nevertheless, ARB is currently trading at $1.14 at the time of writing, reflecting a marginal 0.20% decline from its peak within the past 24 hours. Despite this minor setback, overall market sentiment remains optimistic as traders believe in the upward trajectory.
ARB’s market capitalization experienced a slight decrease of 0.14% during the decline to reach $1,451,587,645. However, there was a notable surge in its 24-hour trading volume, which rose by 27.80% to $156,143,642. This surge in trading volume suggests that the Arbitrum market continues to attract significant interest and engagement. Savvy traders might seize the opportunity presented by the temporary price drop to accumulate ARB tokens, anticipating a potential rebound and upward trajectory shortly.

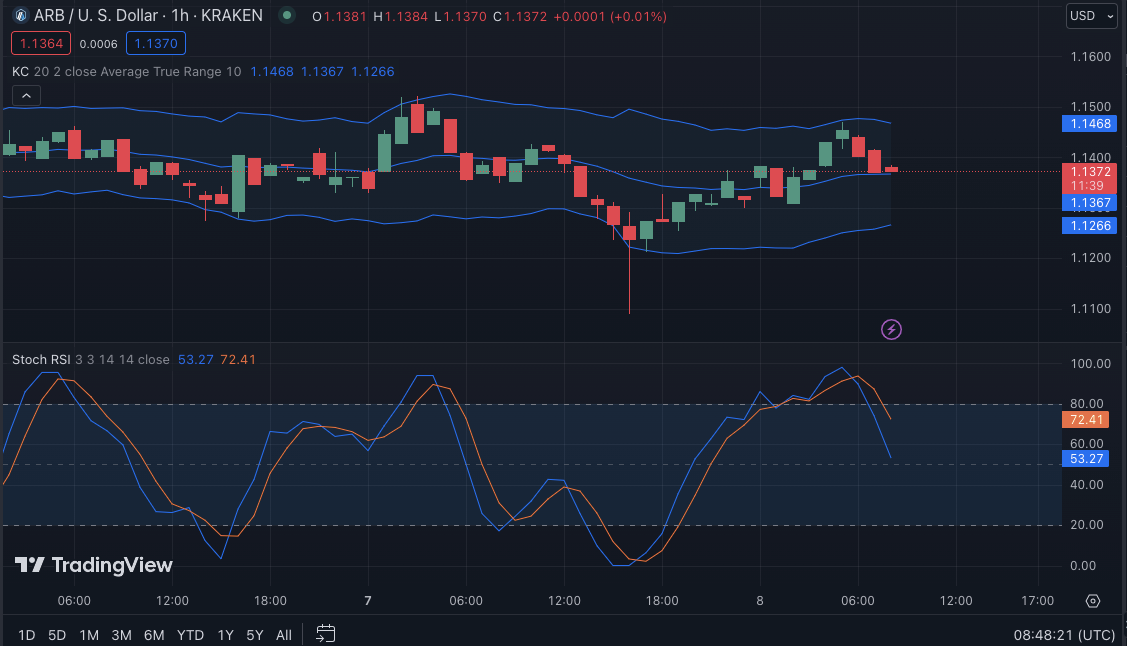
The ARBUSD price chart displays a contraction in the Keltner Channel bands, as evidenced by the upper, middle, and lower bands converging at $1.1468, $1.1368, and $1.1267, respectively. This narrowing of the bands suggests a consolidation phase and a possible reduction in market volatility. Experienced traders may perceive this as a signal for an imminent breakout or a potential reversal in the prevailing trend of the ARBUSD price.
The market is experiencing a downtrend, as evidenced by the price action displaying red candlesticks moving towards the middle band. This pattern suggests the presence of selling pressure and potentially signifies a continuation of the decline in ARBUSD price.
The stochastic RSI (53.27) continuing its southward movement below the signal line suggests that the downtrend is still strong. A breach below the 50 level would validate the bearish sentiment and potentially result in a further decline in the ARBUSD price. Nevertheless, should the market discover support and witness an upward movement in the stochastic RSI, it may indicate a potential reversal in the ongoing downtrend.

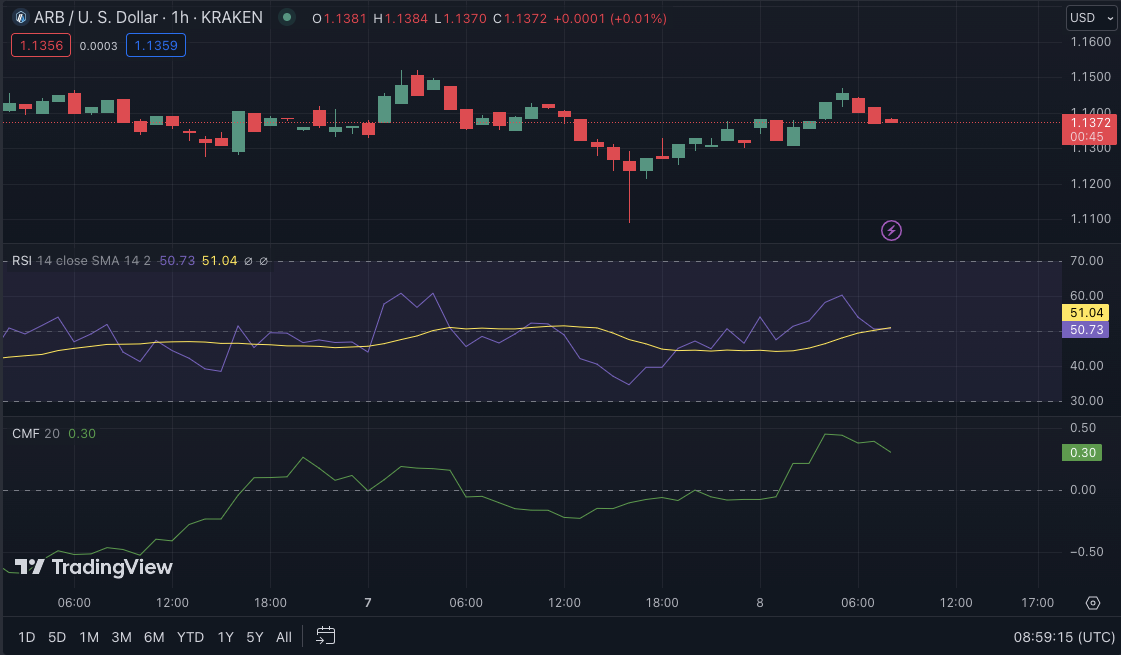
The Relative Strength Index (RSI) shows a downward trend, standing at 50.73, which suggests that the market is still experiencing selling pressure. If the RSI drops below the critical level of 50, it would validate the bearish sentiment and potentially lead to a further decline in ARBUSD.
In cryptocurrency, when the Relative Strength Index (RSI) exhibits an upward trajectory and surpasses the 50 mark, it could signify a shift towards a bullish sentiment and a reversal of the prevailing downtrend.
With a reading of 0.30, the Chaikin Money Flow also indicates a downward trend, suggesting a continued outflow of funds from ARBUSD. This reinforces the bearish sentiment as it signifies that selling pressure outweighs buying pressure. If this trend persists, it could further decline the price of ARBUSD.

To summarize, although ARB’s rebound indicates promising prospects, it is essential to exercise caution due to the presence of bearish indicators such as RSI and CMF, which raise concerns about the durability of the upward trend.
Disclaimer: The insights, perspectives, and data presented in this price analysis are published in good faith. Readers must conduct their own research due diligence. Any decision made by the reader is solely their responsibility, and Crypto Outlooks shall not be held responsible for any consequential or incidental harm or loss.


