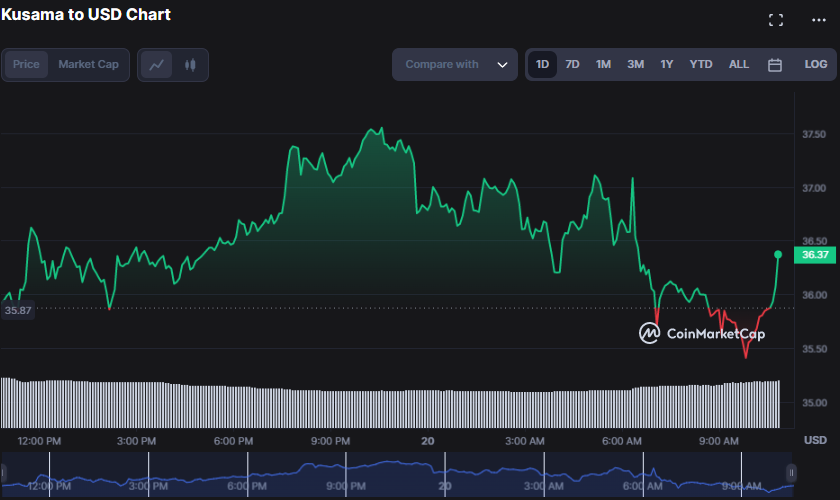
Over the past 24 hours, the Kusama (KSM) market has experienced a notable surge in bullish pressure, resulting in price fluctuations ranging from $35.37 to $37.55. As of the publication, the bullish momentum has slightly subsided, with KSM currently trading at $36.02, representing a modest gain of 0.34%.
Although the 24-hour trading volume has experienced a 7.03% decrease, the market capitalization has increased by 0.38% to reach $305,398,813. This indicates that investors are still keen on the market, despite the slowdown. However, the drop in trading volume may have made them more cautious about significant transactions.
If the current bearish trend persists, the support level of $35.37 may be breached, leading to possible support levels at $32.91 and $30.56. However, a breakthrough of the resistance level at $37.55 could indicate a bullish reversal, thereby presenting an opportunity to test the subsequent resistance level at $40. It is important to remain vigilant and monitor market movements closely.

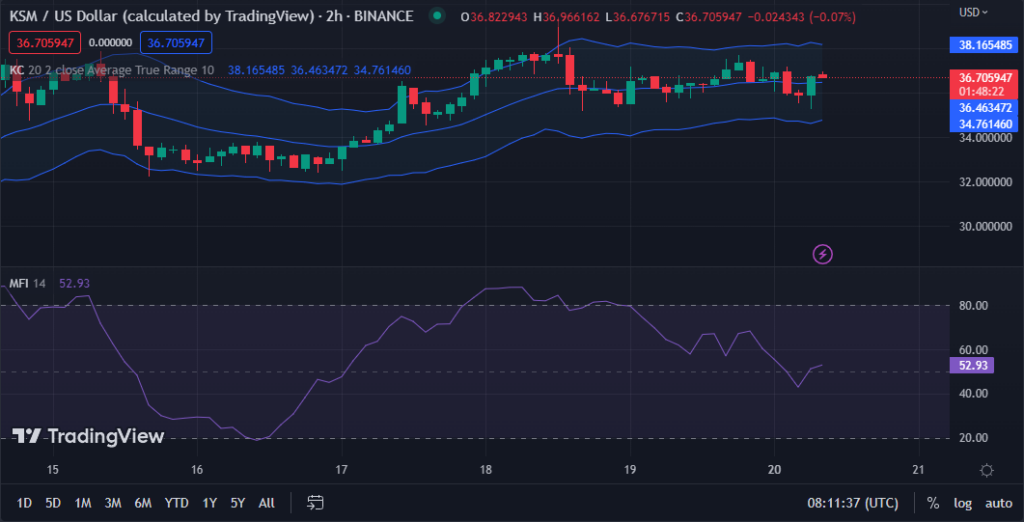
The KSM/USD, 4-hour price chart shows a noteworthy development as the Keltner Channel bands expand, signaling a market volatility surge. This uptick in volatility could shortly lead to substantial price swings, presenting a promising opportunity for daring traders. The upper band has reached 38.173982, while the lower band has touched 34.794381, underscoring the heightened volatility.
The emergence of a green candlestick in the price action, as it ascends towards the upper band, clearly indicates that the bullish momentum in the market is still robust, with buyers firmly at the helm. This development has heightened traders’ anticipation of a favorable breakout, thereby opening up the possibility of further gains in the KSM market.
The Money Flow Index (MFI) has surged to 52.42, bolstering the optimistic outlook for the KSM market. This uptick in MFI implies a potential surge in buying pressure and upward momentum, signaling a promising trend for investors and traders looking to establish long positions. The MFI level indicates a steady inflow of money into the KSM market, a positive sign for those seeking to capitalize on the market’s growth potential.

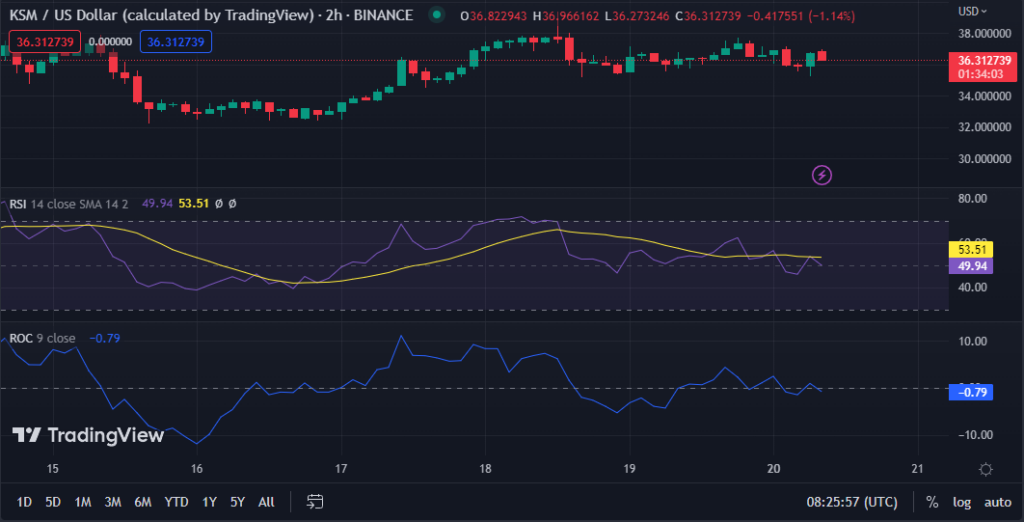
The KSMUSD chart has recently witnessed a bearish crossing on the Relative Strength Index (RSI), with a value of 52.39 moving below its signal line. Despite the market’s buoyancy, this development suggests a potential reversal shortly. The RSI’s downward trend indicates a waning purchasing momentum, which could pave the way for sellers to take control. As such, investors should remain vigilant and consider adjusting their strategies accordingly.
The Rate of Change (ROC) has dipped below the zero mark, registering a value of -0.79, corroborating the prevailing pessimistic outlook. This development indicates that the market’s upward trajectory is losing steam, and a shift toward bearish sentiment may be on the horizon.
The rationale behind this decision stems from the fact that a negative rate of change (ROC) signifies a heightened pace of divestment among investors, thereby reflecting a diminished level of confidence in the market’s bullish trajectory.

The KSM market is experiencing a gradual decline in bullish dominance and a surge in volatility. This shift in market dynamics has created many trading opportunities for investors who remain cautiously optimistic. As the market evolves, traders must stay vigilant and adapt their strategies accordingly.
Disclaimer: The insights, perspectives, and data presented in this price analysis are published in good faith. Readers must conduct their own research due diligence. Any decision made by the reader is solely their responsibility, and Crypto Outlooks shall not be held responsible for any consequential or incidental harm or loss.


