- Global cryptocurrency market cap reaches $1.19 trillion with a marginal increase.
- Altcoins like ADA, SOL, DOT, LUNC, and DOGE show potential for profits.
- ADA’s symmetrical triangle pattern indicates a potential price surge.
According to CoinMarketCap, the global cryptocurrency market cap experienced a marginal 24-hour increase of 0.04%, reaching around $1.19 trillion at the reporting time. As we approach the end of the month, investors and traders within the crypto industry are actively seeking out alternative cryptocurrencies, commonly known as altcoins, that exhibit the highest potential for generating profits throughout August.
As of the current press time, several prominent altcoins such as Cardano (ADA), Solana (SOL), Polkadot (DOT), Terra Classic (LUNC), and Dogecoin (DOGE) are on the cusp of activating significant medium-term technical indicators. Suppose these technical indicators are indeed triggered on the charts of these cryptocurrencies. In that case, it has the potential to generate substantial profits for both traders and investors.
Cardano (ADA)
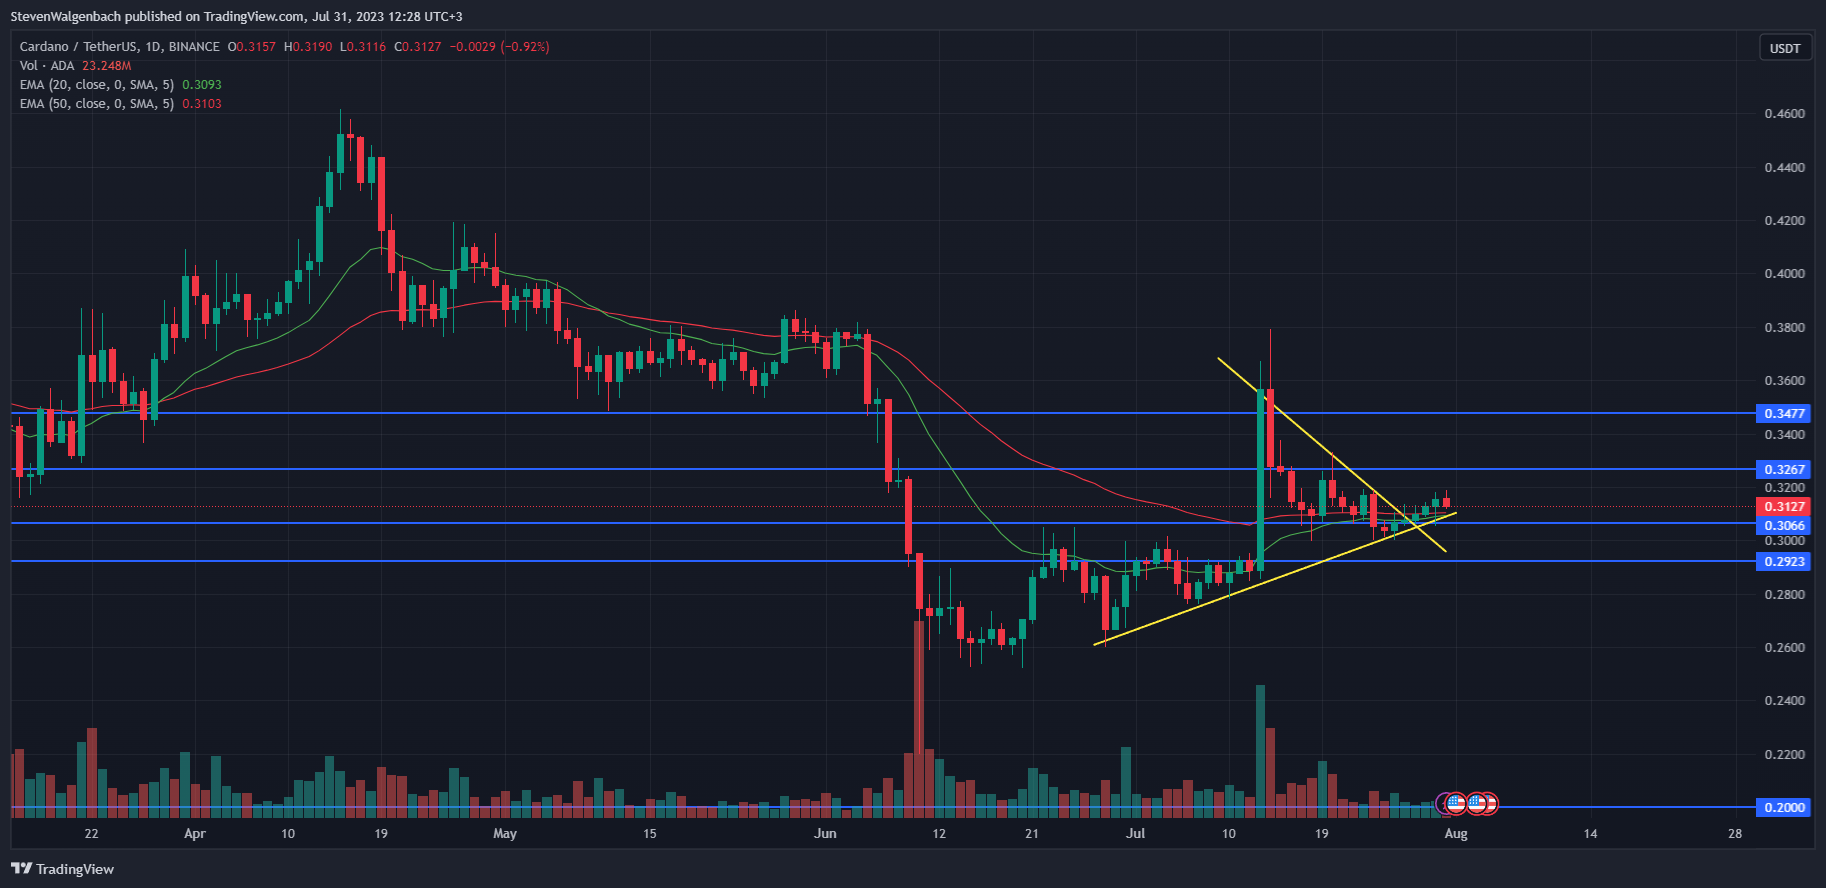
ADA’s daily chart has recently displayed a symmetrical triangle pattern, which indicates a potential breakout once the apex is reached. ADA’s price has surpassed this pattern over the past five days. Consequently, it is reasonable to anticipate a surge in the altcoin’s price in the upcoming weeks.
During the previous week, the cryptocurrency’s price surpassed the resistance level of $0.3066, effectively transforming it into a support level. If the optimistic outlook is confirmed, ADA’s price might surpass the next resistance level at $0.3267 in the upcoming week. Furthermore, sustained buying pressure could increase the price, reaching $0.3477.
In contrast, if ADA’s price successfully concludes a daily candle below $0.3066 within the next 48 hours, there is a potential for a subsequent decline to $0.2923 over the next couple of weeks. However, the bullish scenario appears more probable, given the imminent activation of a substantial bullish technical flag.
As of the current press time, there is a potential for the 20-day Exponential Moving Average (EMA) line to surpass the 50-day EMA line. This occurrence indicates the initiation of a medium-term bullish cycle for ADA, potentially leading to a price increase in the upcoming weeks.
Solana (SOL)
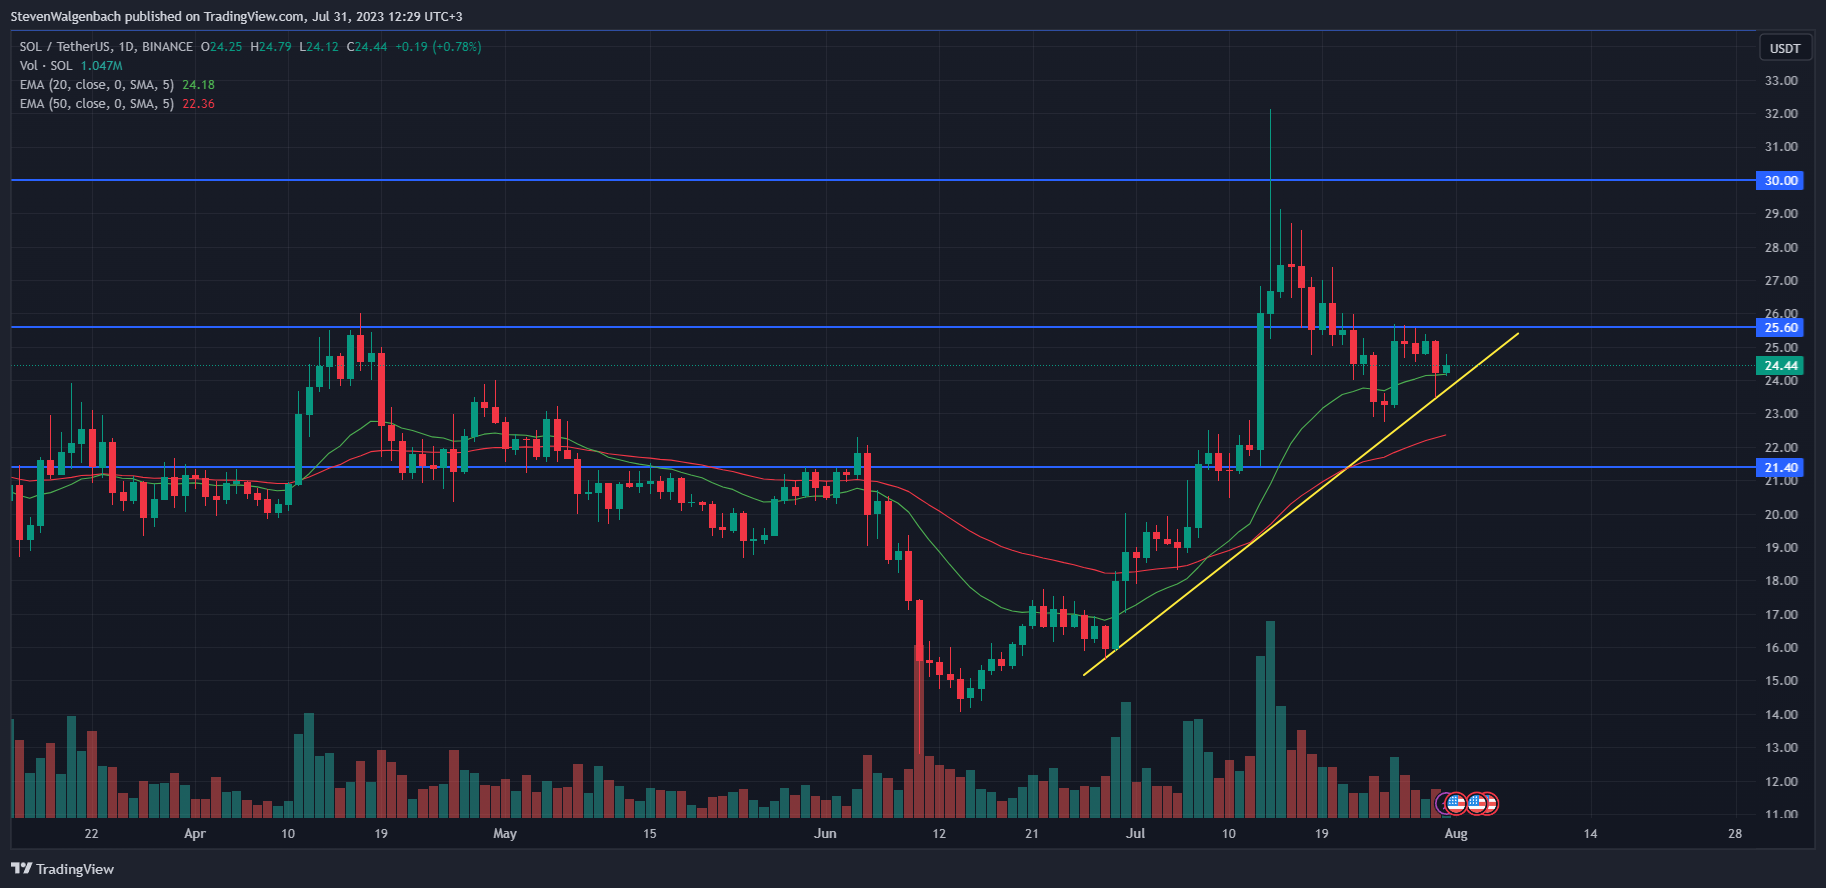
The SOL token experienced a significant decline in the past week, breaching the critical support level of $25.60 and persistently trading below it. Additionally, the prevailing selling pressure has compelled the altcoin’s price to find support on the 20-day Exponential Moving Average (EMA) line. If this technical indicator is breached, there is a potential risk of the token plummeting to $21.40 in the upcoming week.
However, it could undermine the bearish argument if SOL can surpass the 20-day EMA line at $24.18 and maintain this position for the next two daily candles. In such a scenario, SOL’s price may seek to regain the support level of $25.60 within the upcoming days. Subsequently, a breakthrough above this level would pave the way for SOL to ascend to $30 in the following weeks.
Crypto investors and traders should closely monitor the 20-day and 50-day EMA lines over the next fortnight. The 20-day EMA line is favorably positioned above the 50-day EMA line. Nevertheless, reducing the gap between these lines could lead to a bearish cross in the coming weeks. Market participants must stay vigilant and assess any changes in these indicators.
If this cross occurs, it will signal the initiation of a medium-term bearish trend for SOL, potentially leading to a decline in its price. An initial sign pointing towards this possibility would be the breach of the positive trend line established on SOL’s daily chart during the previous month.
Polkadot (DOT)
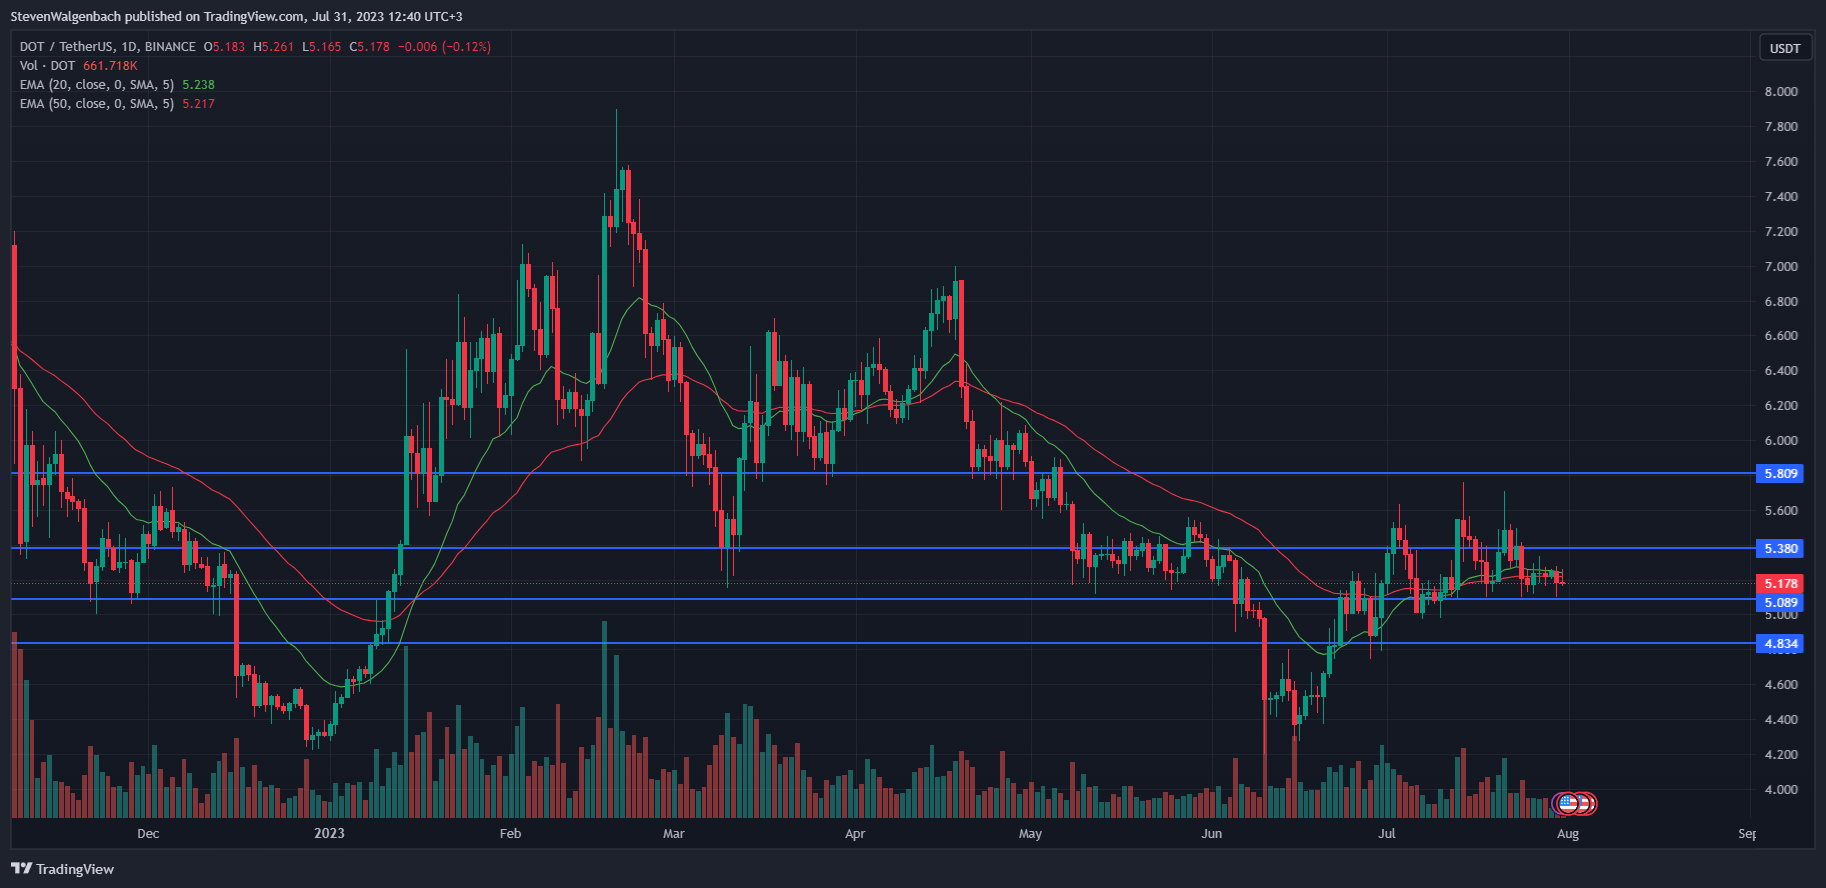
DOT’s daily chart shows a potential bearish technical flag formation, as the 20-day EMA line is about to cross below the 50-day EMA line. This could indicate a bearish trend for the altcoin. If this crossover occurs, the price of DOT may break below the critical support level at $5.089 within the next 24-48 hours, posing a risk to its value.
If the support level is breached, the cryptocurrency may experience a decline to $4.834 within the upcoming week. On the other hand, if DOT manages to successfully surpass the 20-day and 50-day EMA lines, closing a daily candle around $5.238, it would invalidate the bearish outlook. This could increase the altcoin’s price, reaching as high as $5.809 in the coming weeks.
Terra Classic (LUNC)
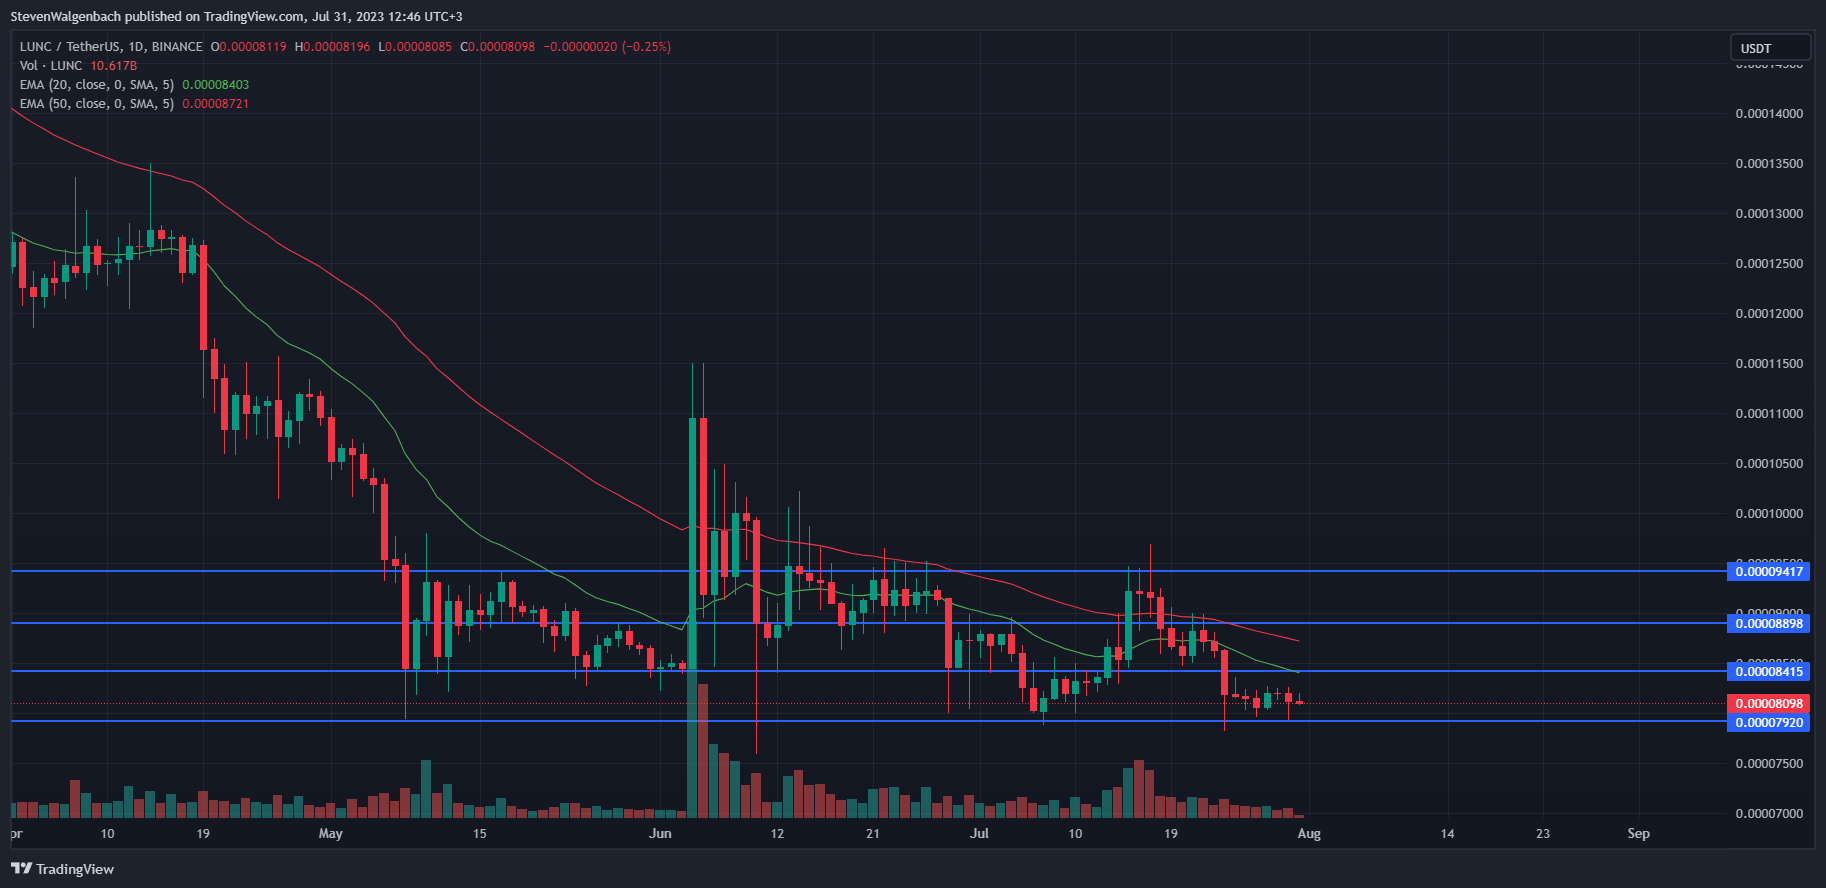
Currently, LUNC faces the possibility of breaching the crucial support level of $0.00007920, which could lead to a significant decline and establish a new record low since its relaunch. Conversely, suppose LUNC successfully concludes a daily candle above $0.00008415. In that case, it will receive reinforcement from the 20-day Exponential Moving Average (EMA) line, paving the way for a potential ascent towards the 50-day EMA line positioned at $0.00008721.
If LUNC surpasses the resistance level of $0.00008898, it could gain the necessary momentum to overcome this obstacle. This breakthrough would pave the way for further upward movement, with a potential target of $0.00009417, provided that bullish market forces continue to drive the cryptocurrency’s price.
Dogecoin (DOGE)
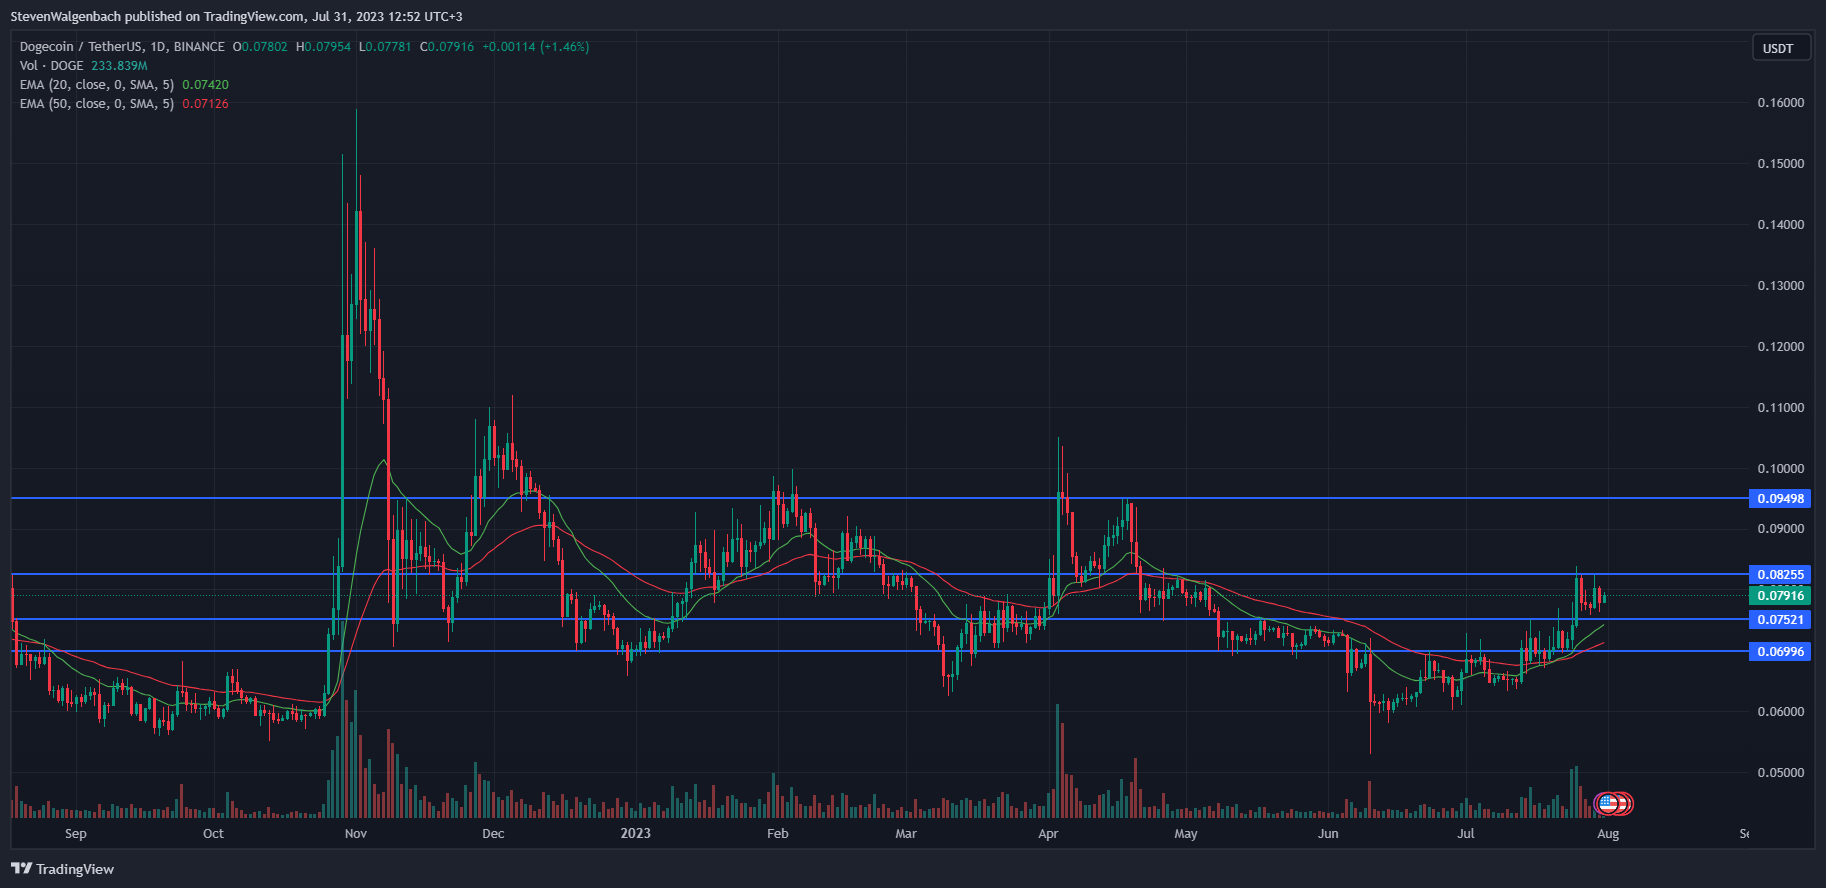
DOGE has been experiencing a period of consolidation, trading within the range of $0.07521 and $0.08255 over the past week. Despite an attempt to surpass this range on Saturday, the altcoin could not do so. However, suppose DOGE breaks above the resistance level of $0.08255 within 48 hours. In that case, it will probably sustain its upward momentum and reach $0.09498 in the subsequent week.
However, should DOGE’s price break below the critical support level of $0.07521, it may decline further to $0.06996 within the upcoming days. It is worth noting that the momentum has been favoring the bulls, as indicated by the 20-day Exponential Moving Average (EMA) line positioned above the 50-day EMA line. This suggests that DOGE is currently experiencing a positive trend in the medium-term, potentially leading to a price increase in the following weeks.
Disclaimer: The insights, perspectives, and data presented in this price analysis are published in good faith. Readers must conduct their own research due diligence. Any decision made by the reader is solely their responsibility, and Crypto Outlooks shall not be held responsible for any consequential or incidental harm or loss.


