- Optimism (OP) experiences a marginal decline in trading price.
- Chainlink (LINK) witnesses a decline in price but maintains favorable position.
- Maker (MKR) shows significant surge in price and strong momentum.
In the coming week, there is potential for significant price movements in Optimism (OP), Chainlink (LINK), and Maker (MKR) as traders seek to capitalize on the prevailing market volatility. Additionally, CoinMarketCap data reveals a modest 0.32% recovery in the overall cryptocurrency market cap within the last 24 hours, bringing the total to approximately $1.17 trillion at the time of writing.
Bitcoin’s (BTC) market dominance experienced a marginal decline in the previous trading day. Despite a mere 0.05% decrease, astute altcoin traders may remain vigilant in pursuing potential trading prospects within smaller market capitalization cryptocurrencies in the forthcoming week.
Optimism (OP)
Based on data from CoinMarketCap, OP witnessed a marginal decline of 0.15% in its trading price within the past 24 hours. Consequently, the cryptocurrency’s current valuation stands at approximately $1.47. Regrettably, this downward trend has also negatively influenced its weekly performance, causing a further descent to -1.50%.

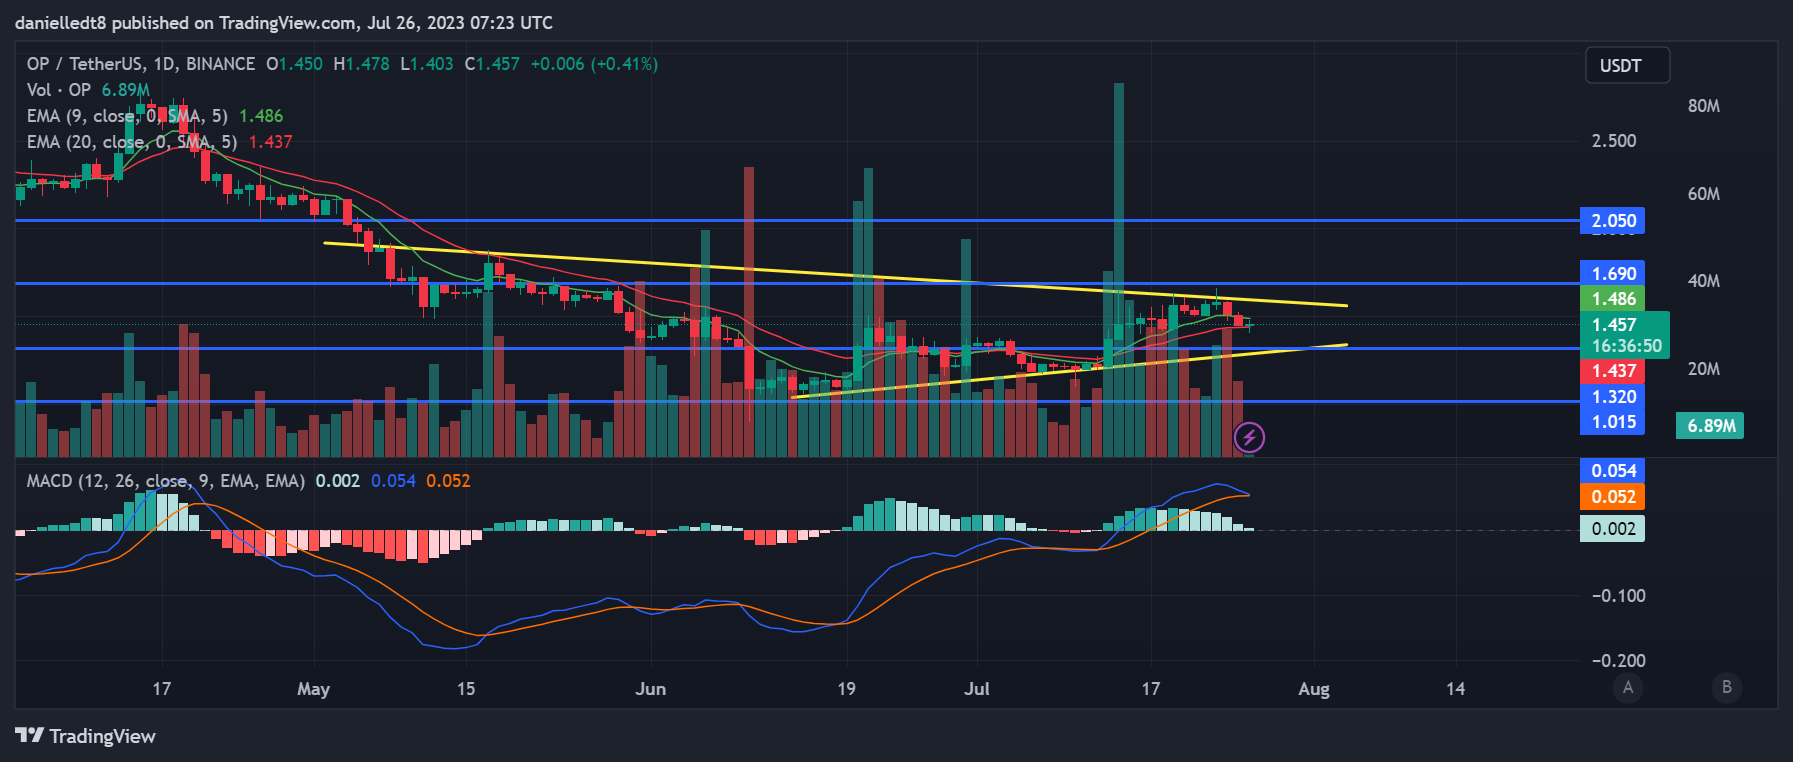
The daily chart of OP displayed a symmetrical triangle pattern, indicating a potential price breakout in the upcoming week for the altcoin. However, it is worth noting that technical indicators are pointing towards a possible downside breakout.
Initially, there was a potential bearish technical flag formation on the horizon as the MACD indicator indicated a possible crossover with the MACD Signal line. Furthermore, the price of OP had dipped below the 9-day EMA line within the last 48 hours. Although it had also breached the 20-day EMA line earlier today, it managed to bounce back and regain its position above this crucial technical indicator.
If the closing price of today’s daily candle for OP falls below the 20-day EMA line at $1.437, there is a potential risk for the altcoin’s price to test the significant support level at $1.320. A breach below this level could further decline OP’s price, possibly reaching as low as $1.015 within the next few days.
Alternatively, should the 9-day EMA line at $1.486 be surpassed in today’s closing, OP could successfully convert the $1.690 resistance level into a supportive one. Furthermore, sustained buying pressure may propel the cryptocurrency’s value towards the subsequent significant resistance point at $2.050.
Chainlink (LINK)
In the last 24 hours, LINK witnessed a decline in its price, with a decrease of 0.90%, to reach a trading value of $7.44 at the time of writing. Nevertheless, despite this recent downturn, LINK has maintained a favorable position over the past seven days, exhibiting a growth of over 7% during this period.
Furthermore, within the last 24 hours, the altcoin experienced a notable surge of 9% in its trading volume, reaching an impressive $236,412,647. Simultaneously, its market capitalization stood at $4,004,142,227, positioning LINK as the 20th largest cryptocurrency in terms of market capitalization.

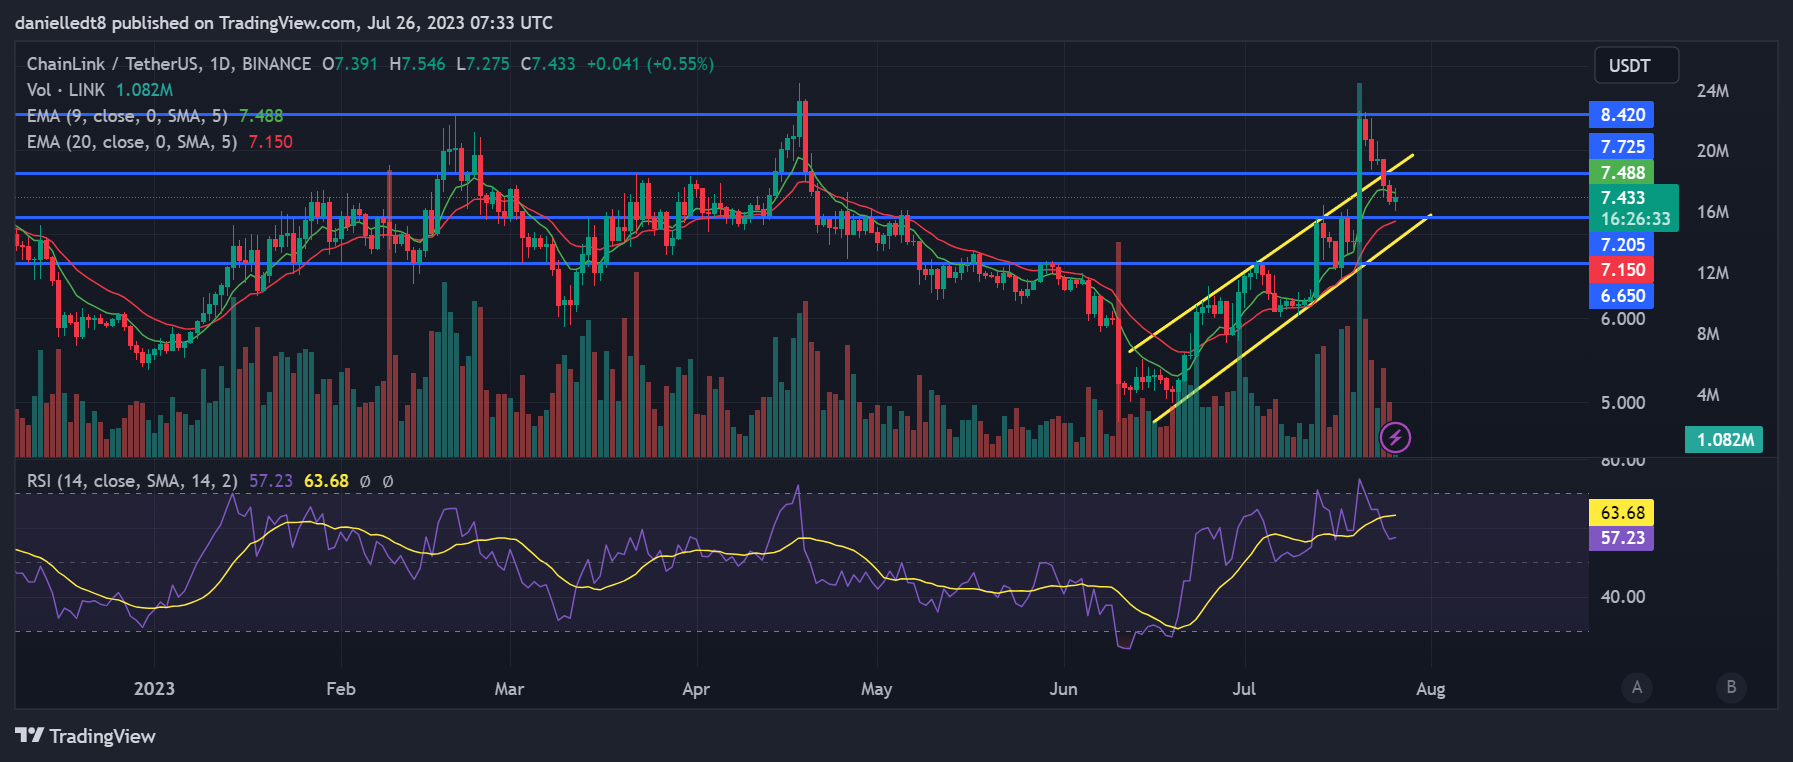
LINK’s price has recently rebounded and re-entered a bullish price channel on its daily chart, which had been forming over the past few weeks. This followed a bearish trend in the past few days. Additionally, the altcoin’s price decline caused it to fall below the 9-day Exponential Moving Average (EMA) line, where it currently remains at the time of writing.
If LINK concludes today’s daily candle below the significant support level of $7.205, it is possible to descend further below the mentioned price channel and test the subsequent support at $6.650 within the upcoming week. Conversely, if LINK’s price experiences a rebound from the $7.205 support within the next 24-48 hours, it could surpass the resistance level of $7.725.
The ongoing influx of buying activity may drive the altcoin’s price to peak at $8,420 in the upcoming week. Monitoring the daily Relative Strength Index (RSI) as a technical indicator is crucial. The RSI indicates that LINK is neutral, implying there is still potential for further price appreciation before it becomes overbought.
Furthermore, it is worth noting that the daily Relative Strength Index (RSI) line was currently trading below the RSI Simple Moving Average (SMA) line. However, there is a potential for these two lines to intersect shortly. If this intersection occurs, it could indicate that buyers in the market possess sufficient momentum to drive the price up to $8.420 within the upcoming days.
Maker (MKR)
Unlike OP and LINK, MKR experienced a significant surge of more than 5% in the previous trading day, leading to a current valuation of $1,152.31 for this cryptocurrency. This impressive 24-hour performance also translated into a remarkable 12.08% growth in MKR’s weekly performance, showcasing its strong momentum in the market.
Furthermore, MKR demonstrated notable resilience against Bitcoin (BTC) and Ethereum (ETH), exhibiting a 4.61% and 4.71% appreciation, respectively. Moreover, the altcoin’s trading volume within 24 hours reached $125,770,610, marking a substantial 44.04% surge compared to the preceding day.

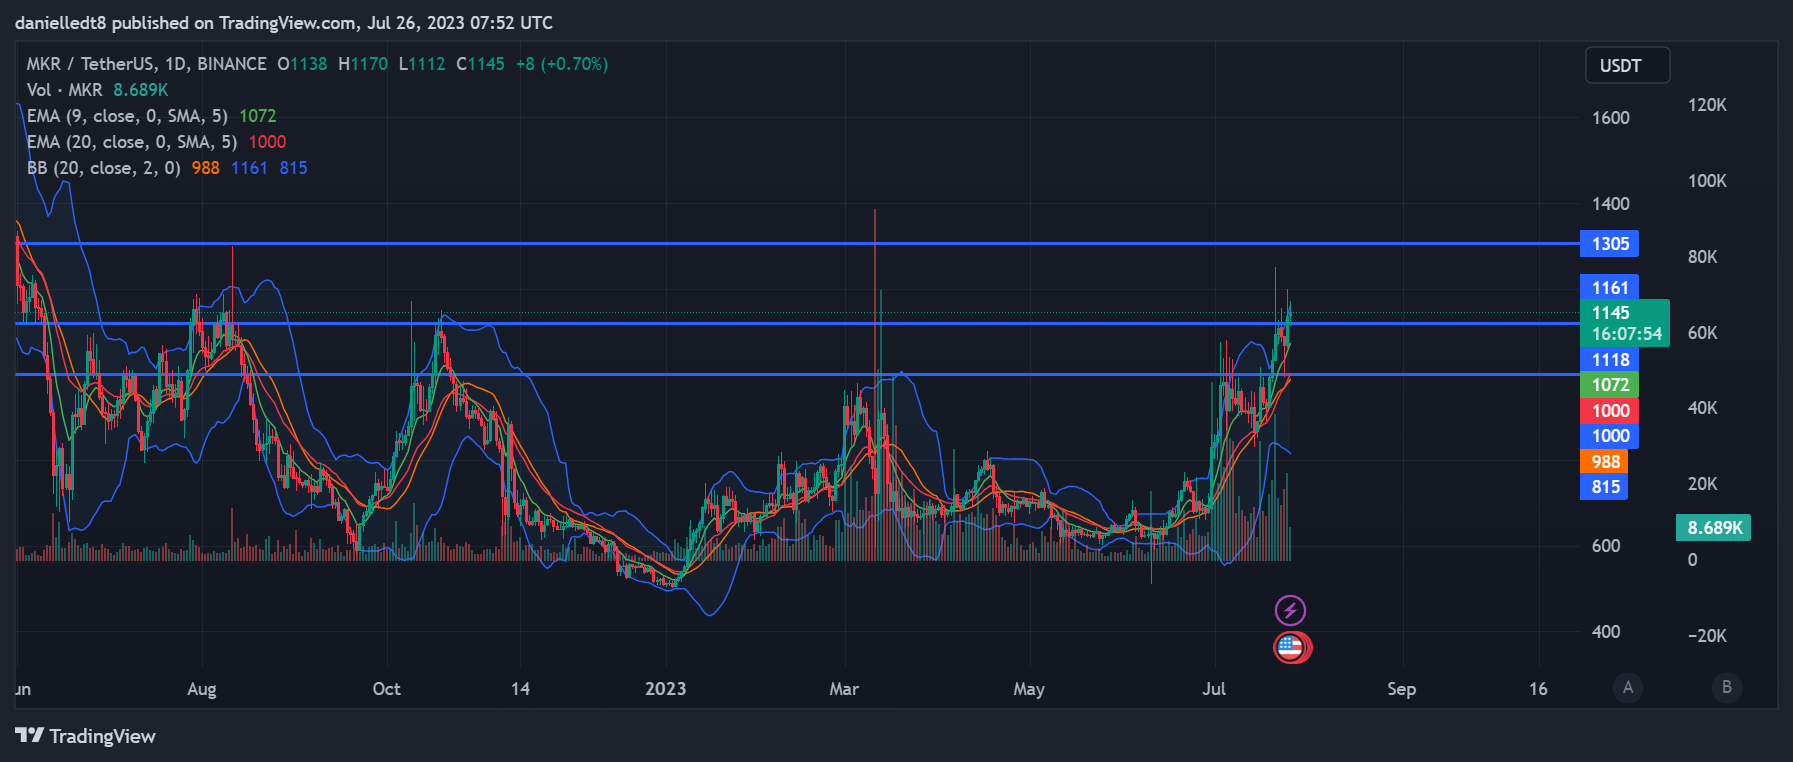
Over the past 48 hours, MKR successfully surpassed the $1,118 resistance level and established it as a support level. However, caution is advised as the altcoin’s price is currently trading near the upper band of the Bollinger Bands indicator. This could lead to a decline in MKR’s price within 24-48 hours.
If the bearish thesis is confirmed, MKR can decline below the recently surpassed level of $1,118 and potentially reach the 9-day EMA line at $1,072 shortly. If the cryptocurrency’s price fails to maintain support at the 9-day EMA line, it may drop to $1,000 within the following week.
In contrast, should MKR successfully maintain a closing price above $1,118 within the next 48 hours, it has the potential to surpass the upper boundary of the Bollinger Band. This could lead to an endeavor to breach the subsequent significant resistance level at $1,305 during the forthcoming week.
Disclaimer: The insights, perspectives, and data presented in this price analysis are published in good faith. Readers must conduct their own research due diligence. Any decision made by the reader is solely their responsibility, and Crypto Outlooks shall not be held responsible for any consequential or incidental harm or loss.


