- Polygon (MATIC) experienced a significant downturn, briefly dropping below $0.78.
- Altcoin witnessed a decline of 2.32% in its value in the past 24 hours.
- Bullish sentiment resulted in a notable increase of 6.61% for MATIC in the last 30 days.
Polygon (MATIC) experienced a significant downturn, briefly dropping below $0.78, which surprisingly persisted for five days. Within the past 24 hours, the altcoin witnessed a decline of 2.32% in its value. However, over the last 30 days, bullish sentiment predominantly influenced the market, resulting in a notable increase of 6.61% for MATIC.
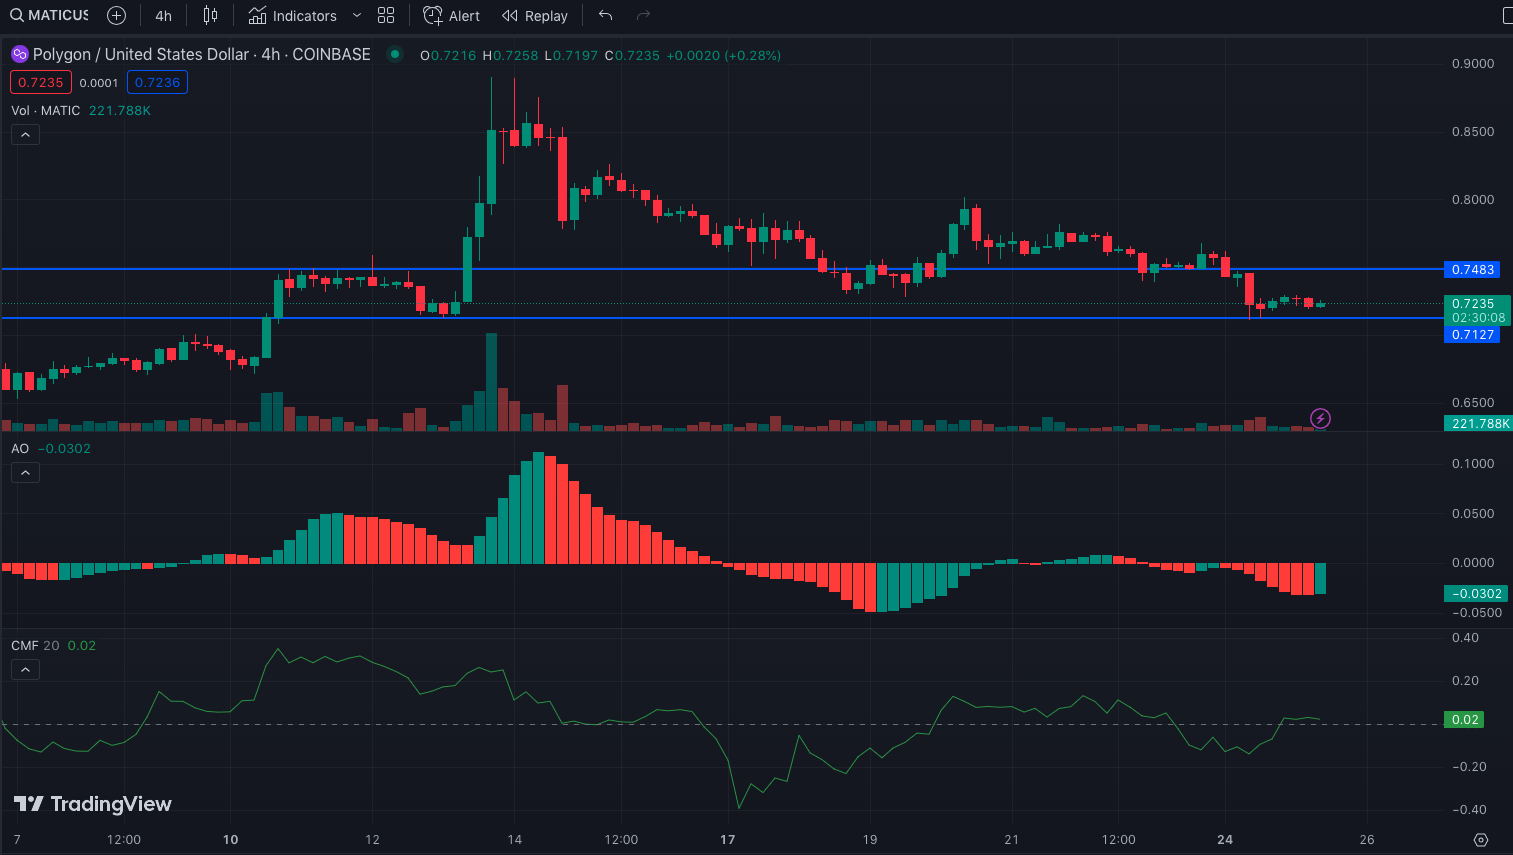
The 4-hour chart for MATIC/USD reveals the altcoin’s consolidation near a critical support level of $0.71. The diminished demand has resulted in a decline in MATIC’s purchasing power, suggesting a bearish sentiment around the $0.72 mark.
For MATIC to re-establish a bullish trend, the price must surpass the significant psychological barrier at $0.74. However, if the selling pressure surpasses the demand, it could hinder the ongoing recovery endeavor.
Moreover, the prevailing bearish sentiment has exerted downward pressure on bullish dominance, as evidenced by the negative reading of -0.0302 on the Awesome Oscillator (AO) at the current moment.
The AO, residing in the negative zone, suggests that the 5-period Moving Average (MA) was below the 34-period Moving Average (MA). Consequently, the bears hold significant influence over the price movement unless the 5-period MA manages to overpower the dominance of the 34-period MA.
However, traders in the crypto industry should exercise caution and closely monitor the Chaikin Money Flow (CMF) to validate the strength of the MATIC price. As of the current moment, the CMF stands at 0.02. While the indicator remains above the zero line, its proximity to this threshold indicates a potential weakness in the buying pressure within the market.

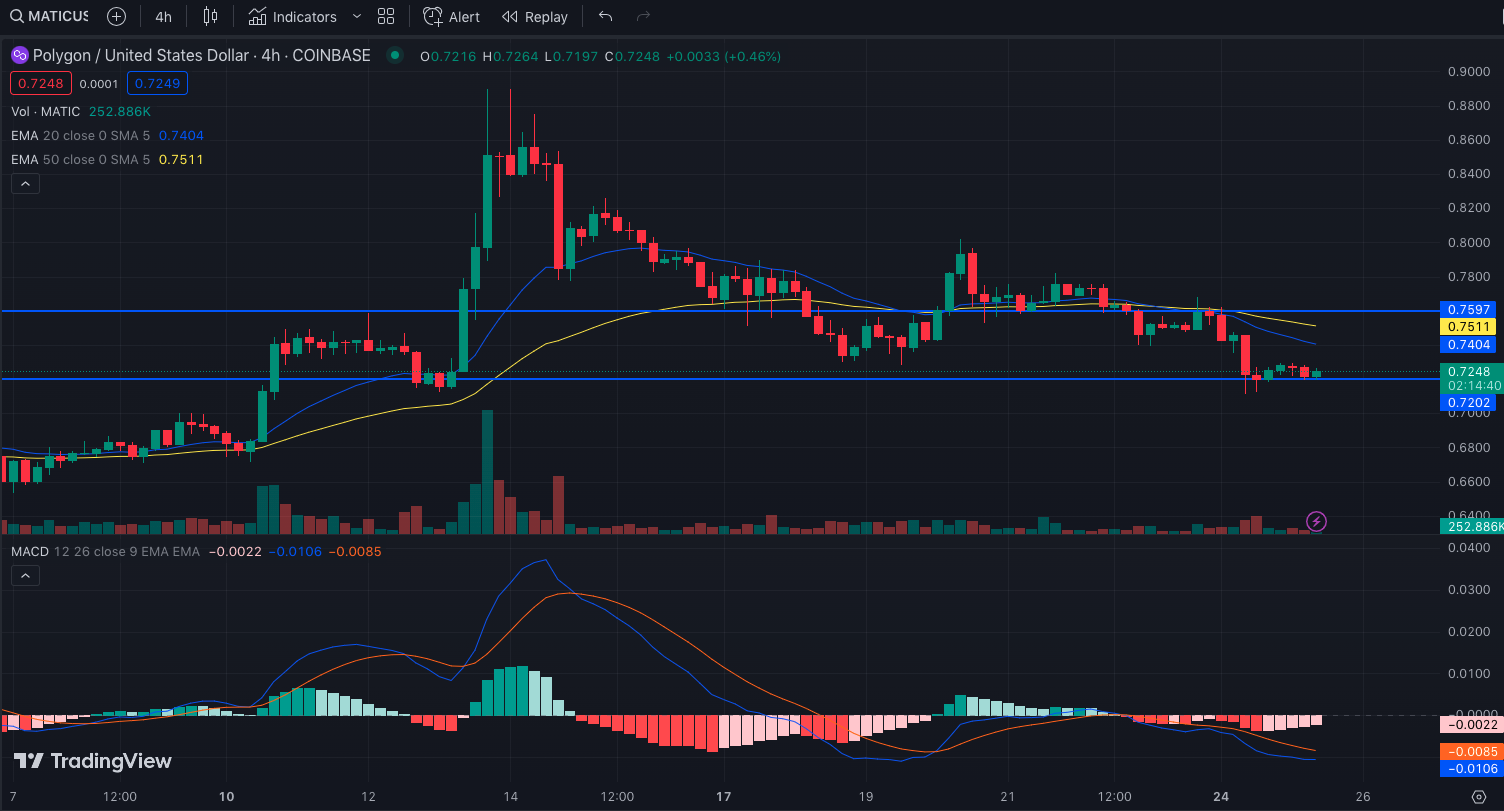
Like the CMF, the Moving Average Convergence Divergence (MACD) signaled a potential increase in MATIC’s downward momentum. Currently, the MACD registered a value of -0.0022, indicating that the 12-day Exponential Moving Average (EMA) was positioned below the 26-day EMA.
Upon further analysis of a different set of Exponential Moving Averages (EMAs), it became evident that the 50 EMA (represented by the color yellow) had intersected the 20 EMA (represented by the color blue) on the 4-hour chart. This occurrence indicates a bearish crossover, suggesting that traders in the cryptocurrency industry may consider adopting a short-selling position for MATIC in the short to intermediate term.
For MATIC to regain its bullish momentum, the bulls must generate a substantial surge in demand that surpasses the prevailing bearish dominance at the $0.72 level. Nevertheless, the likelihood of a reversal appears slim, as evident by the signs of buyer exhaustion.

In summary, MATIC may be experiencing further downward movement in the coming days. However, if the broader market, particularly Bitcoin (BTC), undergoes a revival, it may influence the altcoin to sustain its decline from its peak.
Disclaimer: The insights, perspectives, and data presented in this price analysis are published in good faith. Readers must conduct their own research due diligence. Any decision made by the reader is solely their responsibility, and Crypto Outlooks shall not be held responsible for any consequential or incidental harm or loss.


