- Bitcoin’s current trading value reflects a decline of over 3%.
- BTC’s daily trading volume experienced a significant decline of over 27%.
- BTC’s price fell below crucial support levels, indicating a potential bearish trend.
The previous week has witnessed positive developments for numerous cryptocurrencies, notably Bitcoin (BTC), the frontrunner in the crypto market. Regrettably, according to CoinMarketCap’s latest data, BTC’s current trading value stands at $30,295.31, reflecting a decline of over 3% within the past 24 hours.
As a result, BTC was hovering near its daily low of $29,966.39 rather than its 24-hour high of $31,354.48. Furthermore, the daily trading volume of BTC experienced a significant decline of over 27% during the previous trading day, resulting in a total volume of approximately $18.64 billion at the time of this update.
Despite the recent decline in BTC’s price, it managed to maintain a positive weekly performance of +0.49%. Moreover, over the past month, BTC exhibited a significant growth of 21.78%. Notably, BTC outperformed the leading altcoin Ethereum (ETH), by registering a 0.14% increase against it.

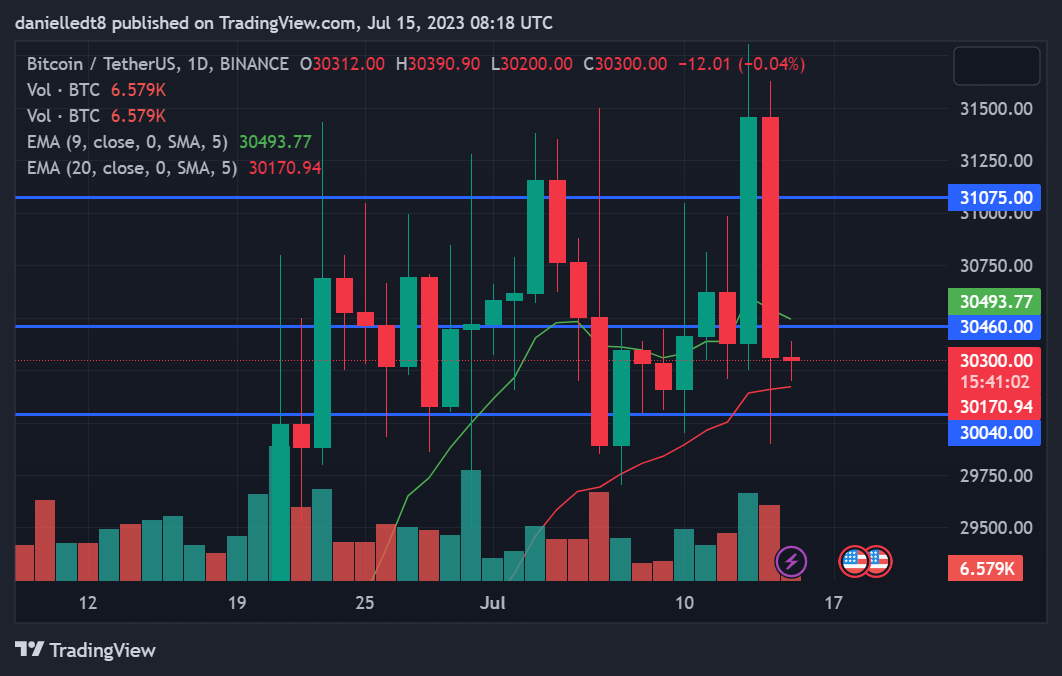
BTC’s price experienced a significant decline in the past 24 hours, falling below the crucial support levels of $31,075.00 and $30,460.00. At the time of writing, it remained below these levels. It is worth mentioning that the cryptocurrency’s price was also trading within the range of the 9-day and 20-day Exponential Moving Average (EMA) lines.
If the leading cryptocurrency’s price falls below the 20-day Exponential Moving Average (EMA) line in today’s trading session, it could also lose the support level of $30,040.400 within the next 48 hours. Conversely, if there is a breakthrough above the 9-day EMA line during today’s trading session, it could result in Bitcoin (BTC) reclaiming the support level of $30,460.00 and potentially experiencing a rise to $31,075.00 in the subsequent days.
Crypto industry professionals should closely track the convergence of the two Exponential Moving Average (EMA) lines over the next 24-48 hours. This is a crucial technical indicator to watch. If the 9-day EMA line falls below the 20-day EMA line, it will indicate a short-term bearish trend for BTC. Consequently, there is a high probability of a price decline within 48 hours after the crossover of these two lines.
Disclaimer: The insights, perspectives, and data presented in this price analysis are published in good faith. Readers must conduct their own research due diligence. Any decision made by the reader is solely their responsibility, and Crypto Outlooks shall not be held responsible for any consequential or incidental harm or loss.


