- Polkadot (DOT) reached a 30-day high but struggled to surpass $5.28 resistance.
- U.S. Consumer Price Inflation (CPI) data had no positive impact on DOT trend.
- DOT experienced a decline, reaching a daily low of $5.13.
Polkadot (DOT) experienced a notable surge on July 3, reaching a 30-day high. However, it subsequently retraced and has struggled to surpass the resistance level at $5.28. Furthermore, the release of the U.S. Consumer Price Inflation (CPI) data failed to bring about any positive changes in the DOT trend.
Despite the minimal impact of the wider cryptocurrency market, primarily driven by Bitcoin (BTC), DOT experienced a decline, reaching a daily low of $5.13.
Rebounding price power
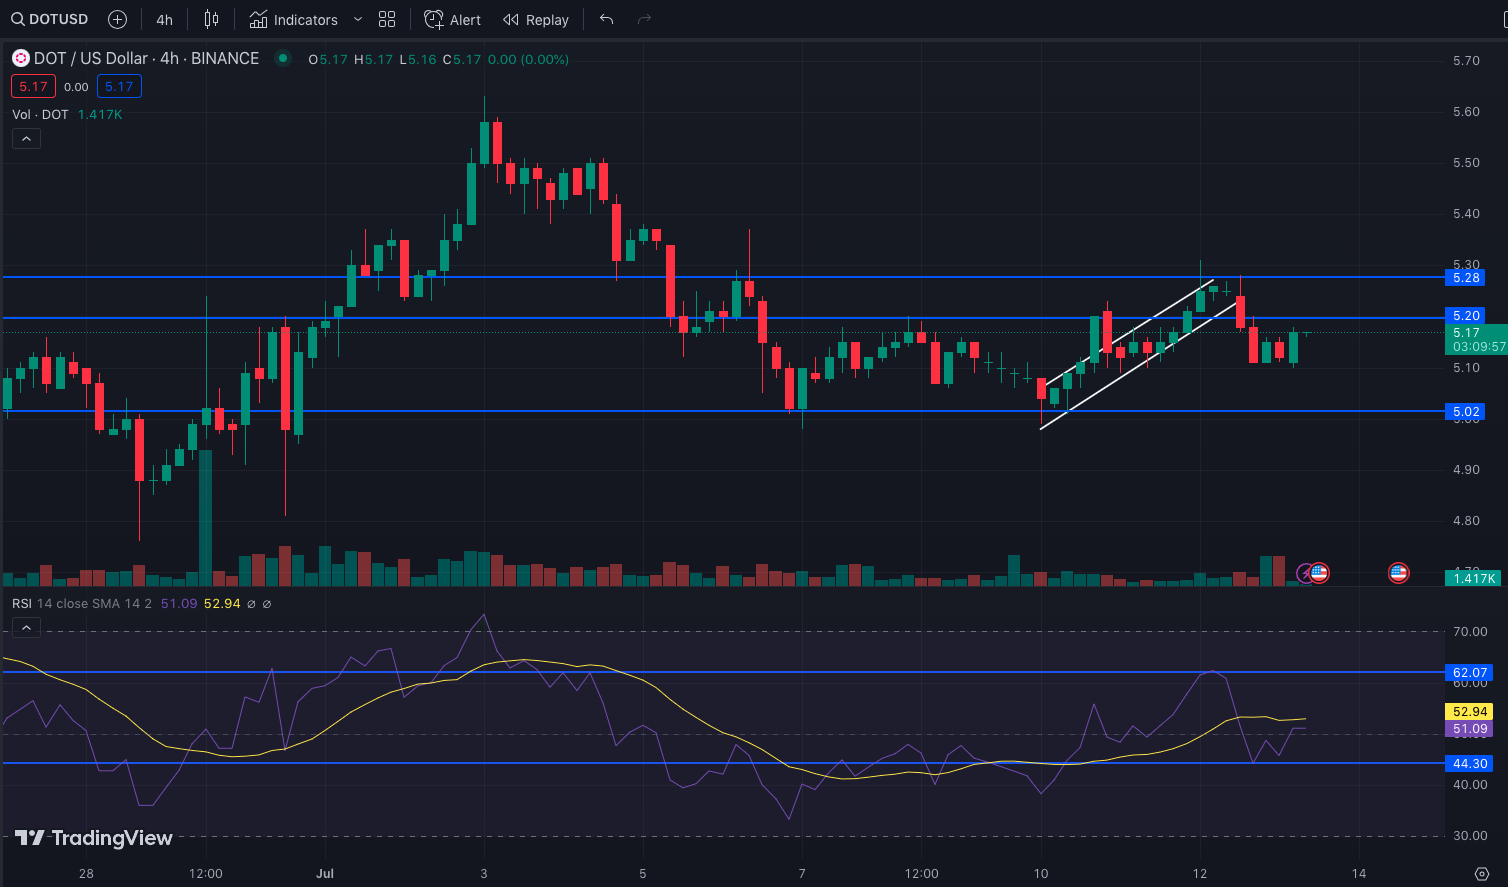
Based on the analysis of the four-hour chart, DOT encountered a significant resistance level of $5.28 on July 6. However, following a period of consolidation, the market sentiment turned bullish, with DOT establishing a support level at $5.02 on July 10. This development sparked increased buying interest, causing the Relative Strength Index (RSI) to surge to $62.07.
However, the price of DOT reached its peak but encountered selling pressure that prevented it from surpassing this level. Consequently, the token’s value declined, decreasing the Relative Strength Index (RSI) to 44.30.
The Relative Strength Index (RSI) has rebounded to 51.09, indicating a resurgence of bullish sentiment in the market. However, for DOT to reach a new peak, it must surpass the resistance level of $5.20. Additionally, the upward momentum needs to strengthen further beyond the 51.09 threshold.

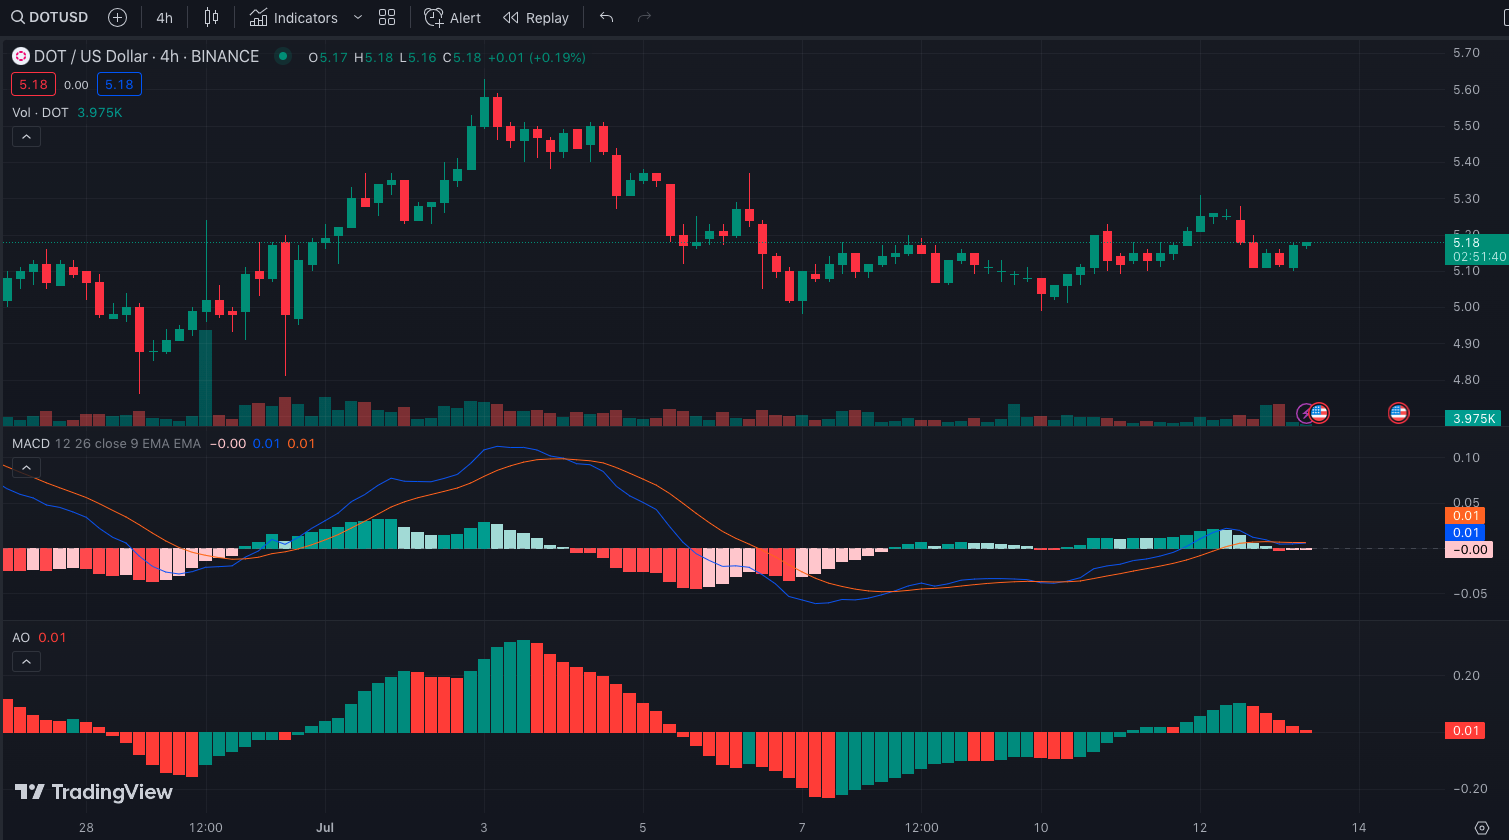
However, achieving another peak may pose a slight challenge in light of the prevailing condition of the Moving Average Convergence Divergence (MACD) indicator. At present, the MACD has undergone a convergence, resulting in a crossover with the 0.00 centerline.
DOT needs to cross over the centerline
This suggests that the 12-period and 26-period Exponential Moving Averages (EMAs) exhibited minimal divergence. However, the Moving Average Convergence Divergence (MACD) indicator showed a bullish crossover, rising above the zero line and slightly above the histogram. This could serve as a significant buy signal for traders in the cryptocurrency industry.
In the event of an increase in demand, a bullish trend may emerge, causing a significant rise in DOT above $5.17. The consecutive appearance of lower red bars on the Awesome Oscillator (A.O.) indicates a weakening of bearish control in the market.
In the crypto industry, a positive A.O. generally indicates that the 5-period fast-moving average surpasses the 34-period slow-moving average. Conversely, a negative reading suggests that the slow-moving average outperforms the fast-moving average.
Like the MACD, the Awesome Oscillator (A.O.) may necessitate a surge in buying activity to propel the 5-period Moving Average (M.A.) above the 34-period M.A. Once this occurs, it could trigger a bullish formation for DOT, eliminating selling pressure.

Currently, DOT may persist in a state of consolation within the market. However, if the indicators align and successfully breach the resistance level of $5.28, DOT’s price could surpass the $5.50 mark, becoming the next target for investors and traders in the cryptocurrency industry.
Disclaimer: The insights, perspectives, and data presented in this price analysis are published in good faith. Readers must conduct their own research due diligence. Any decision made by the reader is solely their responsibility, and Crypto Outlooks shall not be held responsible for any consequential or incidental harm or loss.


