- AVAX experiences a decline of 1.29% in the last 24 hours.
- LINK attempts to surpass resistance level of $6.30.
- ADA undergoes a substantial decline of over 90% from its peak.
The cryptocurrency market has recently witnessed significant price volatility, with several cryptocurrencies displaying strong potential for bullish rallies. ADA, AVAX, ZIL, XRP, and LINK are among the top contenders with promising indications of upward trends.
Avalanche (AVAX)
In the last 24 hours of trading, most of the top 50 cryptocurrencies experienced a decline in their prices, and Avalanche (AVAX) was not an exception, as reported by CoinMarketCap. Currently, AVAX is being traded at $13.06, indicating a decrease of 1.29% within the past 24 hours.
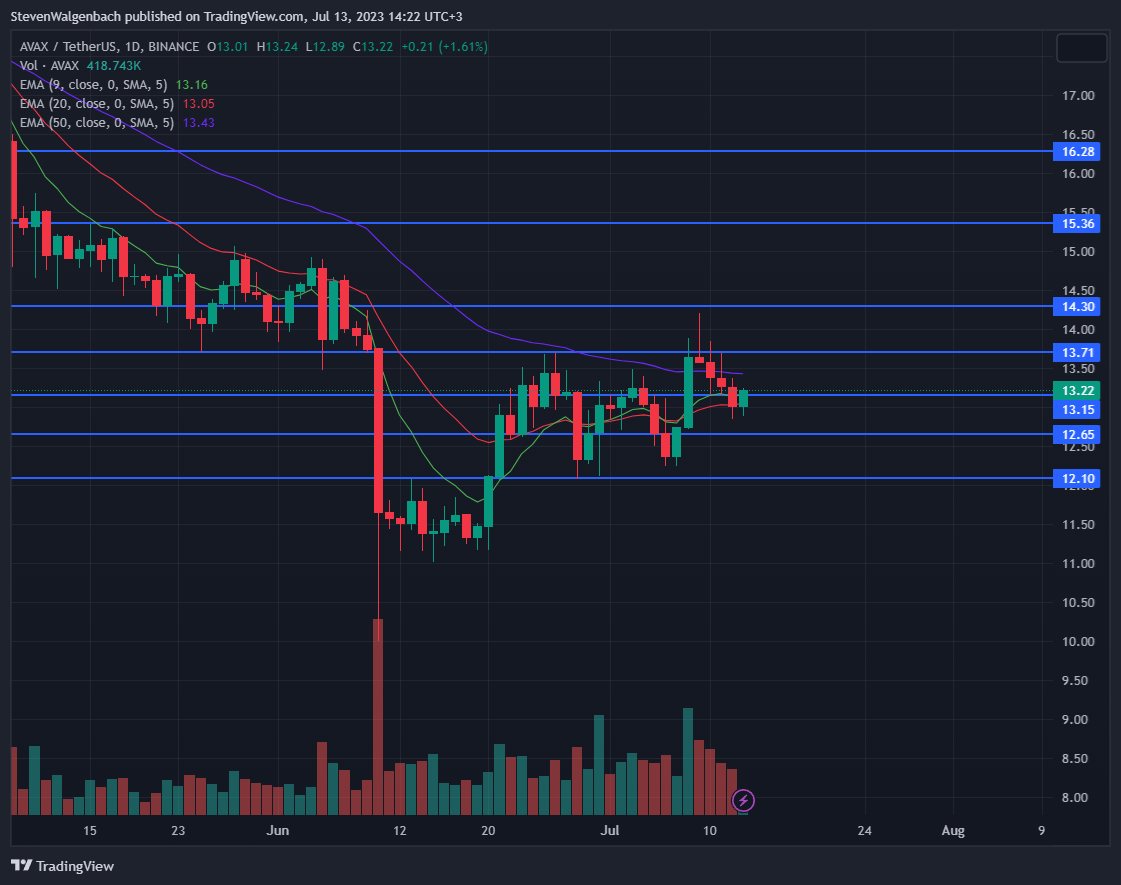
At the time of writing, AVAX was poised to test the significant resistance level of $13.15. If the altcoin surpasses this price point, it could target the 50-day EMA line in the coming days. Surpassing this technical indicator would be a significant milestone for AVAX, signaling the beginning of a rally.
If the bullish thesis materializes, AVAX will surpass the resistance levels at $13.71 and $14.30, effectively transforming them into support levels. Subsequently, the cryptocurrency will only need to overcome the hurdle at $15.36, paving the way for a potential ascent towards $16.28.
Alternatively, should AVAX encounter resistance at the notable $13.15 level today, there is a possibility of a subsequent decline towards the minor support at $12.65 within the next 48 hours. Prolonged selling pressure could drive AVAX further down to the critical support level at $12.10 in the upcoming week.
Traders and investors in the crypto industry should closely monitor the 9-day and 20-day Exponential Moving Average (EMA) lines in the coming days. The 9-day EMA line shows signs of crossing below the longer technical indicator. If this crossover occurs, it would negate the previously bullish outlook and indicate that AVAX has entered a short-term bearish trend. Consequently, AVAX could experience a decline to $12.10.
Chainlink (LINK)
Chainlink (LINK) saw a marginal uptick of 0.72% during the final day of trading, bringing its current valuation to $6.13. However, its weekly performance continued to exhibit a decline of 0.99%.
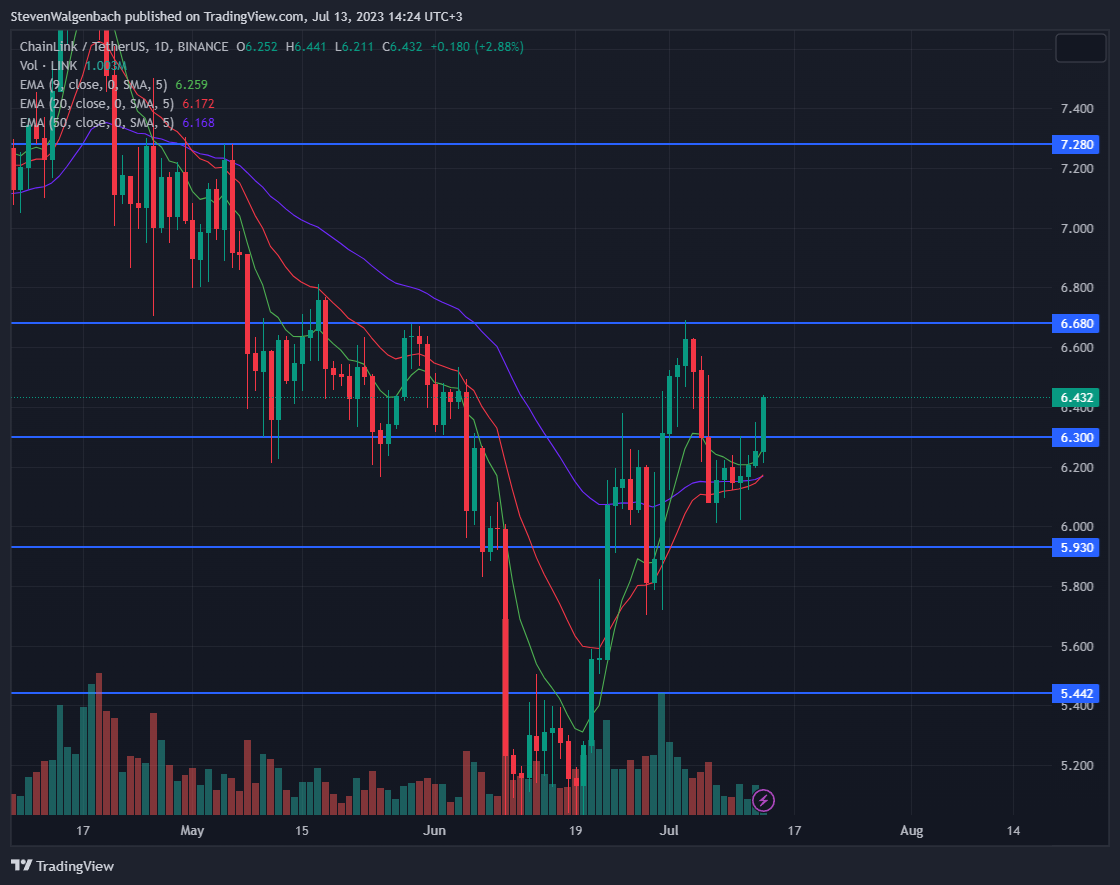
Currently, LINK is trying to surpass the formidable resistance level of $6.30. Within the last 24 hours, it managed to breach this level and has since maintained a trading position above this crucial price point. Should the altcoin successfully conclude today’s daily candle above this resistance level, it could extend its upward trajectory to reach $6.680 in the upcoming week.
Sustained buying momentum has the potential to propel LINK’s price beyond $6.680, opening up an opportunity for the cryptocurrency to reach $7.280. Conversely, if LINK fails to surpass the resistance level of $6.30 by today’s trading session, its price may decline to $5.930 within 24-48 hours. Should selling pressure persist, LINK’s price could drop as low as $5.442 in the upcoming week.
Based on the technical analysis of LINK’s daily chart, there are indications that its price is likely to experience a short-term increase. Additionally, there is a potential for a medium-term bullish technical flag to be activated soon. Notably, the 9-day EMA line has consistently surpassed the longer technical indicators, namely the 20-day and 50-day EMA lines, further supporting the positive outlook over the past few weeks.
This indicated a positive trend for LINK in the short term, suggesting a potential price increase in the coming days. Additionally, the 20-day EMA line showed signs of surpassing the 50-day EMA line. If this crossover occurs, it could provide the necessary momentum for LINK to surpass the resistance levels at $6.68 and reach $7.280 within the next two weeks.
Cardano (ADA)
Cardano (ADA) experienced a downward movement of more than 2% in the last 24 hours, resulting in a price drop to $0.2866. This brought ADA near its daily low of $0.2859. Additionally, comparing its current value to its peak of $3.10 achieved in September 2021, ADA has undergone a substantial decline of over 90%.
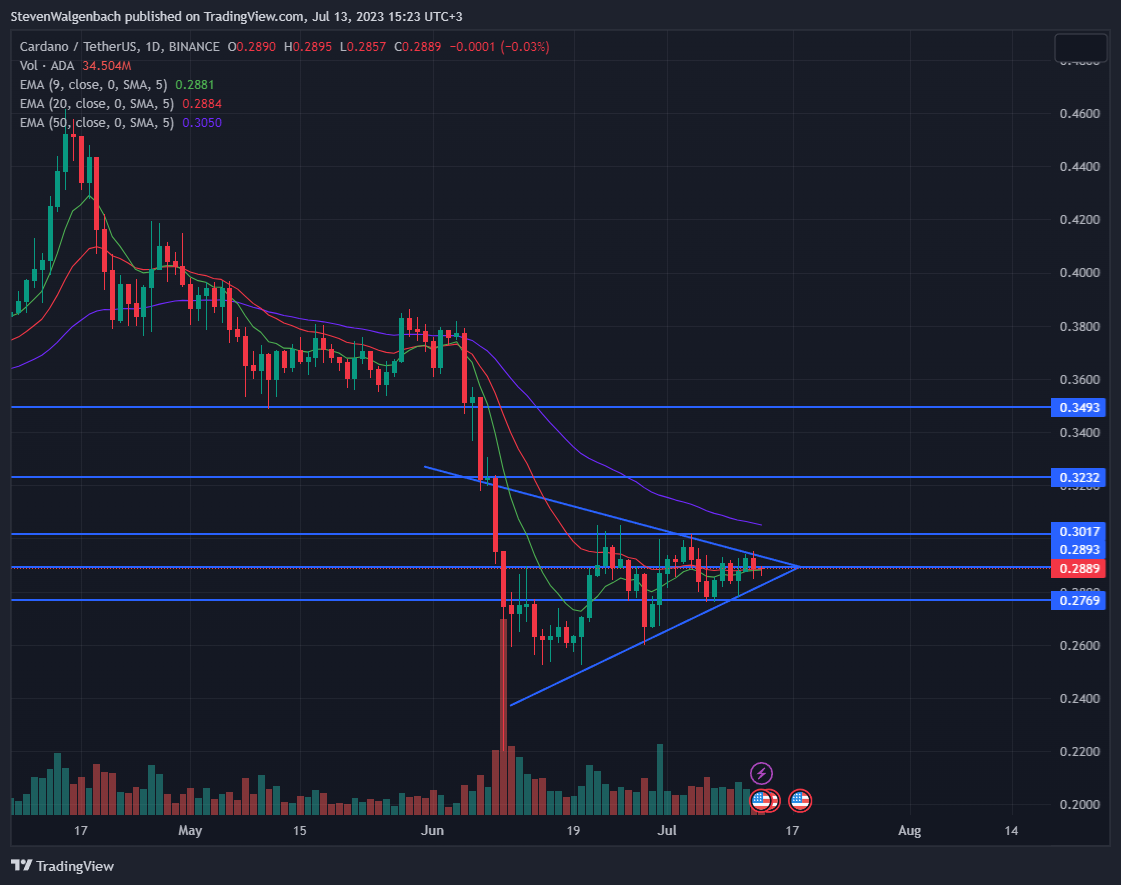
Over the past two weeks, ADA has demonstrated a pattern of printing higher lows and maintaining consistent highs, leading to a bullish pennant formation on its daily chart. Should this chart pattern be confirmed, the altcoin’s price will surpass the resistance level at $0.3017 and establish it as a new support level. Furthermore, this achievement would also result in ADA effectively converting the 50-day EMA line into a supportive factor.
This positive momentum could provide the necessary bullish backing for the cryptocurrency to surpass the resistance levels at $0.3232 and $0.3493 in the upcoming week. Conversely, if ADA’s price fails to maintain above the 9-day and 20-day Exponential Moving Average (EMA) lines, currently around $0.2893, within the next 48 hours, there is a possibility of a downward trend towards the critical support level at $0.2769 within the same timeframe.
Crypto industry professionals should closely monitor the 9-day and 20-day EMA lines in the coming days, as these two technical indicators were nearly converging at the time of writing. If the 9-day EMA falls below the 20-day EMA, it could confirm the bearish thesis unfolding, making it crucial for investors and traders to stay vigilant.
However, if the 9-day Exponential Moving Average (EMA) line surpasses the longer EMA, it will negate the bearish outlook. In such a scenario, ADA’s price could transform the previously mentioned resistance level of $0.3232 into a supportive level within 48 hours.
Ripple (XRP)
Ripple (XRP) witnessed a decline in its price over the past day of trading, registering a 24-hour loss of 0.62%. This downward movement further extended its negative weekly performance to -1.23%. Consequently, Ripple was traded at $0.4722 at the time of writing.
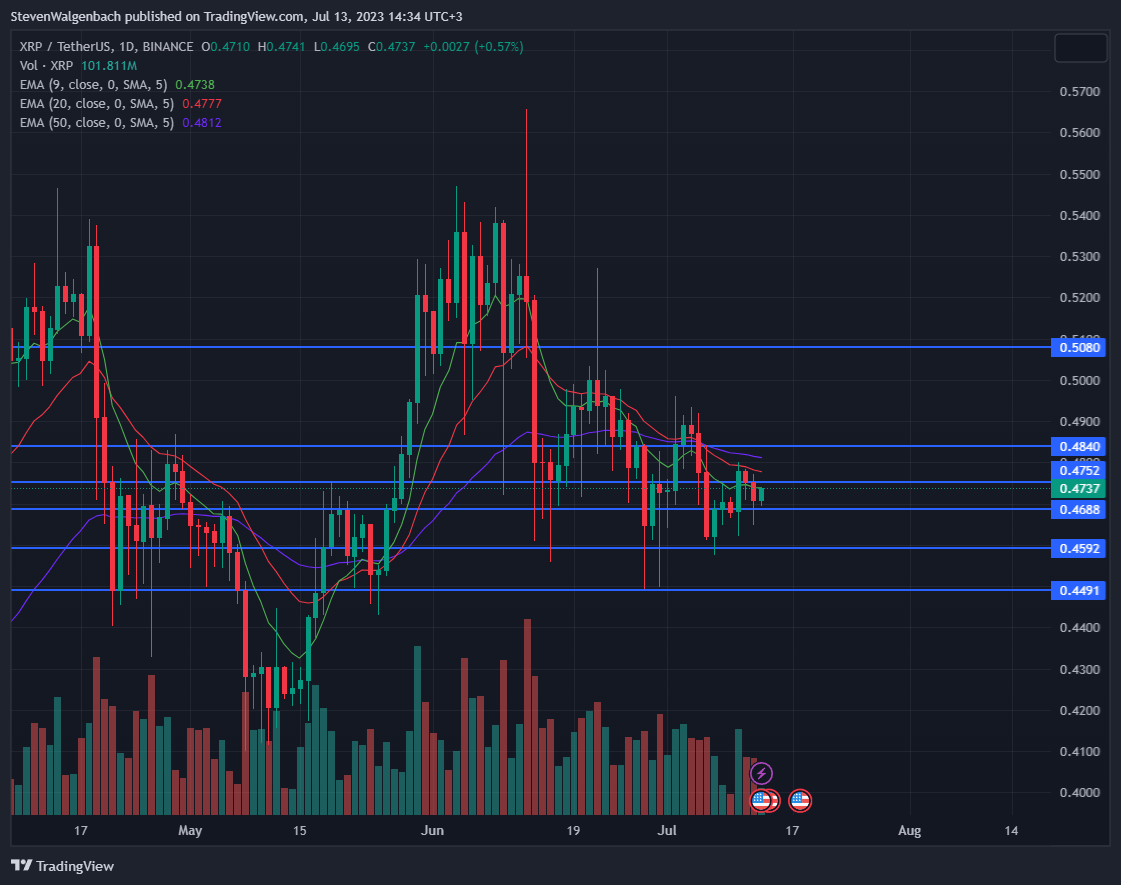
At the time of writing, XRP’s price faced resistance from the 9-day EMA line. However, despite dropping below a significant price point during yesterday’s trading session, the price of the remittance token managed to stay above the support level at $0.4688.
Should XRP successfully surpass the 9-day Exponential Moving Average (EMA) within the next 48 hours, it can potentially convert the resistance level at $0.4752 into a supportive level in a single upward movement. Subsequently, the cryptocurrency must try surpassing the 20-day and 50-day EMA lines before challenging the subsequent significant resistance at $0.484.
Should XRP surpasses the 20-day and 50-day EMA lines, it will encounter minimal obstacles, thereby paving the way for potential price growth to reach $0.5080 within the upcoming week. Conversely, the positive outlook mentioned above will be invalid if XRP falls below the minor support level of $0.4688 within 48 hours.
In the event of such an occurrence, the cryptocurrency’s value could experience a decline to $0.4592 within the next few days. If the selling pressure persists, there is even a potential for XRP to depreciate further to $0.4491 in the upcoming week.
Zilliqa (ZIL)
Zilliqa (ZIL) experienced a slight decline of 1.52% in its price within the last 24 hours, causing its current value to decrease to $0.0207. Consequently, ZIL is trading close to its daily low of $0.0206 rather than its peak of $0.02109 within 24 hours.
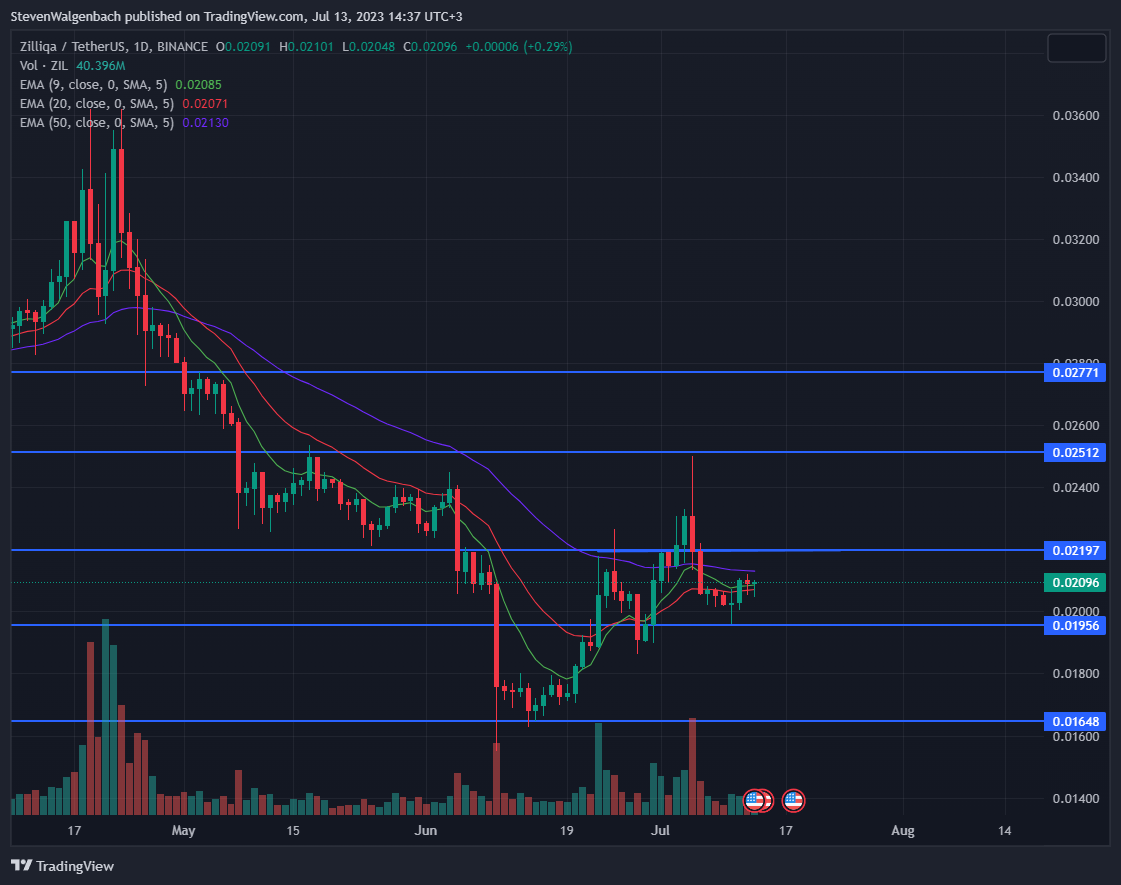
The bulls pushed ZIL’s price above the 50-day EMA line, as indicated by a wick beneath today’s daily candle. This could form a bullish hammer candlestick pattern, suggesting that ZIL may have reached a bottom and will likely experience a significant upward movement in the coming days.
If the bulls surpass the altcoin’s price above the 50-day EMA line, it could generate enough positive momentum to convert the formidable resistance level at $0.02197 into a supportive one within 24-48 hours. Subsequently, the next price target for ZIL would be $0.02512.
From a technical standpoint, minimal obstacles could impede the altcoin’s ascent to the next significant resistance level within the next two weeks. Sustained bullish momentum might even propel ZIL to attain a price of $0.02771 by the end of the current month.
The bullish outlook for ZIL will be negated if it fails to sustain a daily candle close above the 50-day EMA line mentioned earlier within the next 48 hours. In such a case, there is a possibility of a short-term decline to $0.01956, with a potential further drop to $0.01648 in the medium term.
Disclaimer: The insights, perspectives, and data presented in this price analysis are published in good faith. Readers must conduct their own research due diligence. Any decision made by the reader is solely their responsibility, and Crypto Outlooks shall not be held responsible for any consequential or incidental harm or loss.


