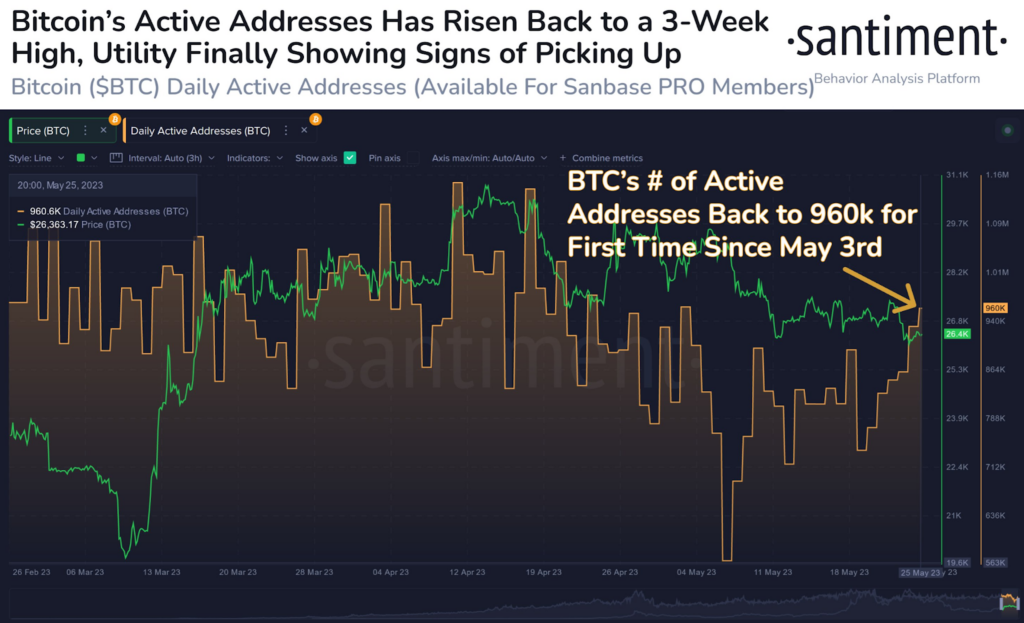
- Bitcoin’s active addresses reach 960K, highest since May 3, 2023.
- BTC’s utility is on the rise, a crucial factor for prolonged upward trend.
- BTC’s price maintains position above $26,960, next resistance at $27,480.
The activity surrounding Bitcoin (BTC) has recently shown signs of resurgence, following a period of worryingly low levels in May. According to a tweet from blockchain intelligence firm Santiment, the number of active addresses for BTC has now reached 960K, marking the first time this figure has been achieved since 3 May 2023. This uptick in activity is a positive sign for the cryptocurrency market and suggests that interest in BTC is again rising.

The on-chain metric has recently experienced a noteworthy resurgence, reaching a 3-week high. This is a promising indication that BTC’s utility is on the rise. As per Santiment’s analysis, a surge in utility is a crucial factor for crypto assets to maintain a prolonged upward trend.
As of the publication, CoinMarketCap reported that the top dog was traded at $27,218.63. This comes after the cryptocurrency experienced a 1.84% surge in price over the last 24 hours. The recent uptick in BTC’s value has turned its weekly performance around, resulting in a positive gain of +0.44%.

In the last 24 hours, BTC’s price has impressively converted the $26,960 resistance level into a solid support level, maintaining its position above this threshold at present. According to technical indicators on BTC’s 4-hour chart, the cryptocurrency’s price will take on the next resistance level at $27,480 within 24-48 hours. This development signals a promising outlook for BTC’s performance shortly.
According to the 4-hour chart, the 9 EMA line has recently made a bullish crossover above the 20 EMA line, indicating that BTC’s price has entered a short-term bullish cycle. Furthermore, the shorter EMA line is breaking away from, the longer EMA line in a bullish manner.
When writing, the 4-hour chart’s RSI indicator indicated a bullish trend, as the RSI line was trading above the RSI SMA line. The RSI line was also positively sloped towards the overbought territory, reinforcing the bullish sentiment.
Disclaimer: The insights, perspectives, and data presented in this price analysis are published in good faith. Readers must conduct their own research due diligence. Any decision made by the reader is solely their responsibility, and Crypto Outlooks shall not be held responsible for any consequential or incidental harm or loss.


