Although CoinMENA announced on May 15 that Shiba Inu (SHIB) would be listed on Bahrain’s Central Bank Regulated Exchange, the market has experienced a bearish trend in the past 24 hours.
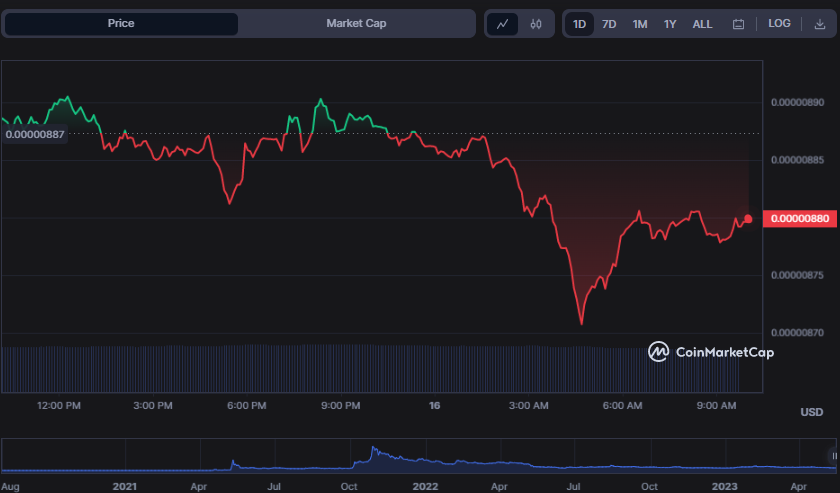
The SHIB price experienced a downward trend, plummeting from an intra-day high of $0.000008907 to a support level of $0.000008707. The bear’s grip on the SHIB market remains firm, resulting in a 0.94% decline to $0.000008797 from the previous closing. These market fluctuations indicate a negative momentum that requires careful monitoring and analysis.
Amidst the downturn, SHIB’s market capitalization and 24-hour trading volume experienced a slight dip of 1.01% and 7.79%, respectively, settling at $5,185,635,602 and $90,016,197.

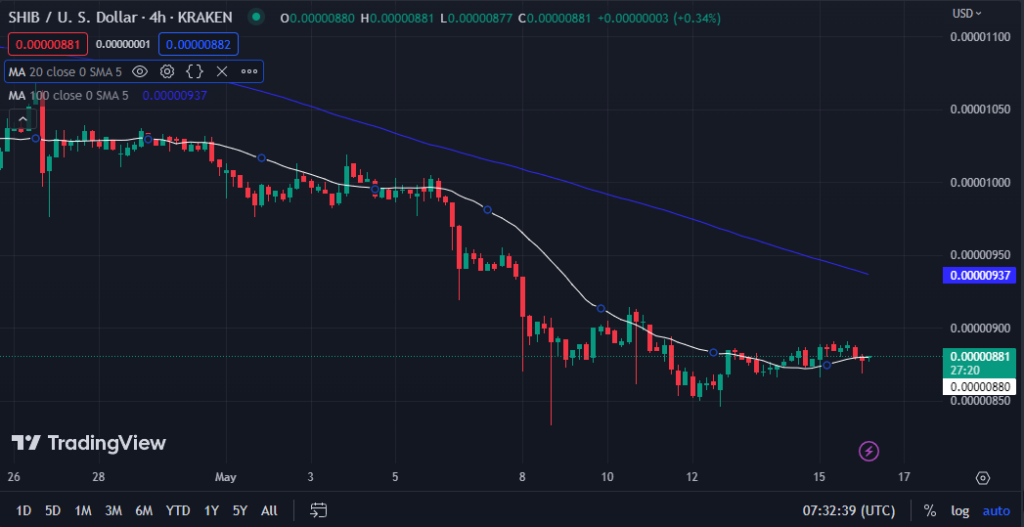
On the SHIB/USD 4-hour chart, the 20-day moving average (white) has dipped below the 100-day moving average (blue), currently at $0.00000880 and $0.00000937, respectively. This shift in the moving averages suggests a notable downward trend in the SHIB market, with the bears holding a strong grip unless the bulls step in.
The SHIB/USD price has recently surpassed the 20-day MA, accompanied by a series of green candlesticks. This development indicates a potential positive reversal as the negative momentum wanes. The crossing over of the 20-day moving average and the emergence of green candlesticks suggest buyers actively enter the market, driving the price upwards. These indicators are promising signs for those closely examining the SHIB/USD market.

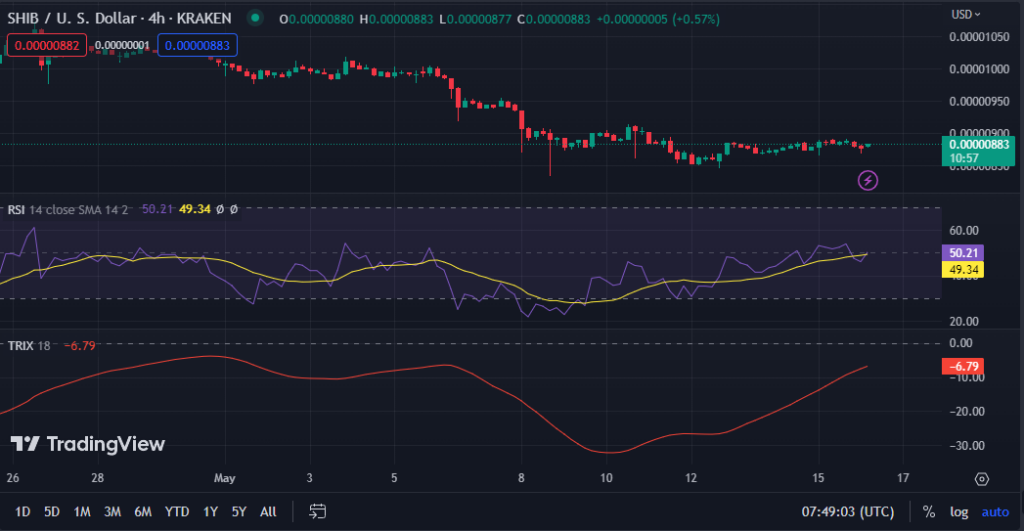
The Relative Strength Index (RSI) has recently surged above its signal line, boasting a value of 50.21. This suggests the market’s downward momentum may be losing steam, as indicated by the RSI’s upward trend.
The RSI movement indicates a surge in purchasing pressure within the market as investors regain their confidence in anticipation of a potential upswing.
The TRIX line’s trajectory is a reliable indicator of the asset’s trend. A positive slope of the TRIX line signifies a bullish trend, indicating an upsurge in the asset’s price momentum. Conversely, a negative slope of the TRIX line suggests a bearish trend, indicating a decline in the asset’s price momentum. As such, monitoring the direction of the TRIX line can provide valuable insights for informed investment decisions.
The TRIX reading for SHIB has steadily risen, currently standing at -6.79. This positive development has led to gradually easing negative pressure in the market, signaling a potential turnaround. Should the TRIX enter positive territory, it could indicate a bullish trend and attract a surge of buyers to the market. As such, investors should closely monitor this indicator and make informed decisions accordingly.

Despite encountering some obstacles in the recent past, the SHIB market is on the upswing as optimistic momentum gains traction and investors begin to show interest.
Disclaimer: The insights, perspectives, and data presented in this price analysis are published in good faith. Readers must conduct their own research due diligence. Any decision made by the reader is solely their responsibility, and Crypto Outlooks shall not be held responsible for any consequential or incidental harm or loss.


