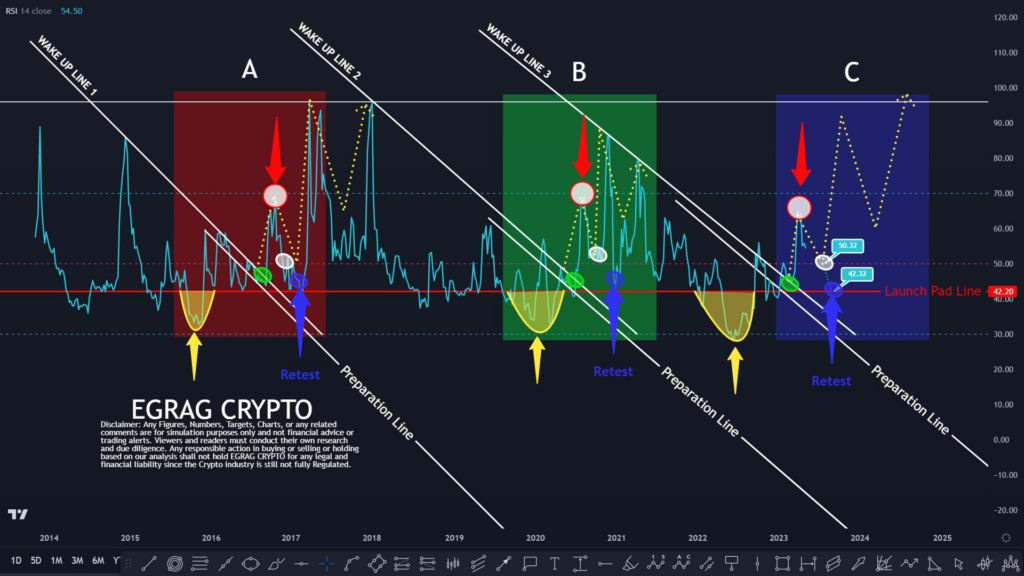
This morning, EGRAG CRYPTO, a seasoned crypto trader and analyst, visited Twitter to share an insightful update on Ripple’s (XRP) analysis. His attention was drawn to the Relative Strength Index (RSI) on XRP’s chart, which he delved into with precision and expertise.

EGRAG CRYPTO has shed light on an intriguing indicator that illuminates a clear path based on historical data. The question on everyone’s mind is whether XRP’s price will soar to new heights shortly, as the RSI is exhibiting a similar pattern to that of 2017 when the remittance token’s price skyrocketed to a higher high.
As of the time of publication, XRP’s value was recorded at $0.4647, having experienced a modest 24-hour increase of 0.47%, as reported by CoinMarketCap. XRP also outperformed the two leading cryptocurrencies, Bitcoin (BTC) and Ethereum (ETH), with gains of 0.38% and 0.35%, respectively.

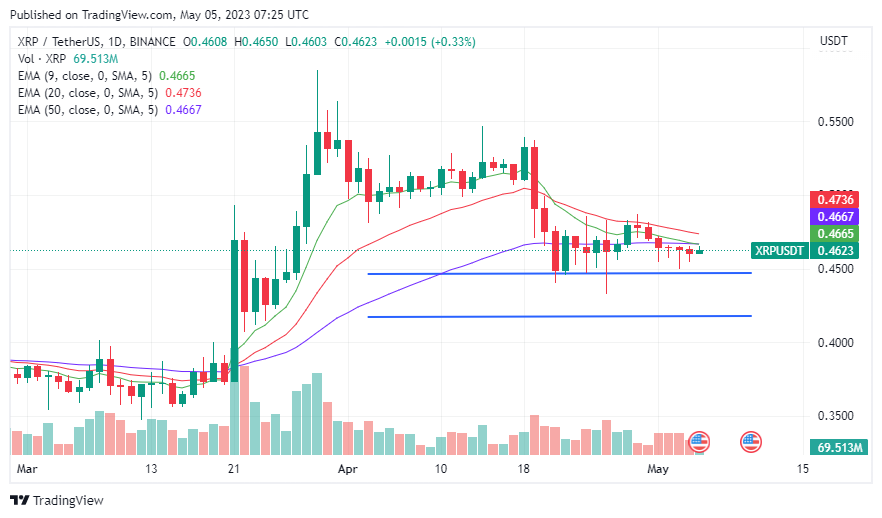
According to technical indicators on XRP’s daily chart, the cryptocurrency’s price may not experience a surge anytime soon. Currently, the 9-day EMA line appears to be on the verge of crossing below the 50-day EMA line, which could have dire consequences for XRP’s value. If this cross occurs within the next 24-48 hours, it could potentially plummet the price to $0.4191.
Traders are advised to closely monitor the 9-day and 50-day EMA lines and the nearest support level at $0.4470. A breach below this critical level will validate the bearish outlook. Conversely, if XRP closes above the 50-day EMA line within 24-48 hours, it will ascend to $0.4925 in the coming days. Traders must remain vigilant and make informed decisions based on these key indicators.
Disclaimer: The insights, perspectives, and data presented in this price analysis are published in good faith. Readers must conduct their own research due diligence. Any decision made by the reader is solely their responsibility, and Crypto Outlooks shall not be held responsible for any consequential or incidental harm or loss.


