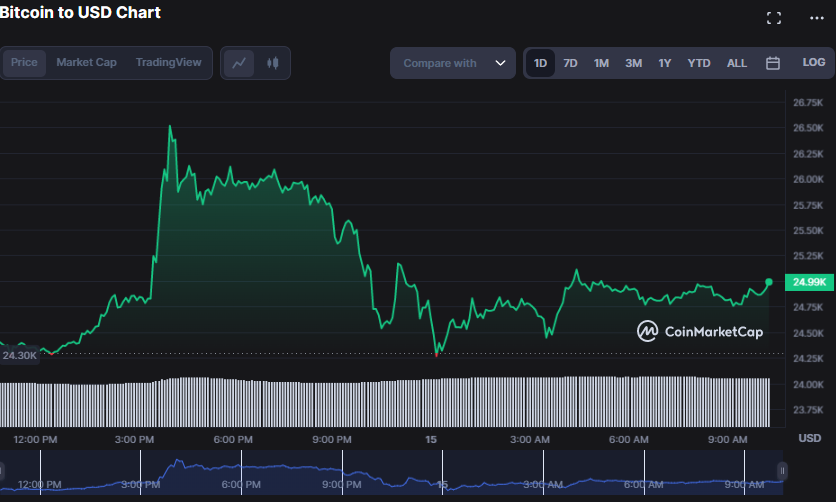
The Bitcoin (BTC) market has witnessed a surge in bullish momentum over the past 24 hours, propelling the price from an intraday low of $24,142.48 to a 90-day high of $26,514.72. However, at present, the bulls are struggling to break through resistance levels, resulting in the price hovering at $24,902.92, reflecting a modest 2.28% increase from its previous close. Despite the current state of affairs, the market remains optimistic about the future of BTC, and investors are keeping a close eye on the developments.
If the bullish momentum persists in the market, the following resistance levels to watch out for, following the breakthrough of $26,514.72, would be $28,000 and $30,000, respectively. Conversely, if bearish pressure takes hold, keep an eye on the support levels hovering around $24,000 and $23,000.
Amid an upturn, the market capitalization and 24-hour trading volume experienced a notable surge of 2.10% and 9.56%, respectively, reaching impressive figures of $481,798,709,117 and $53,002,445,989. This upward trend indicates a growing optimism among investors, as evidenced by their heightened interest and willingness to buy and sell at more favorable prices. With such positive indicators, this momentum will likely propel the market forward shortly.

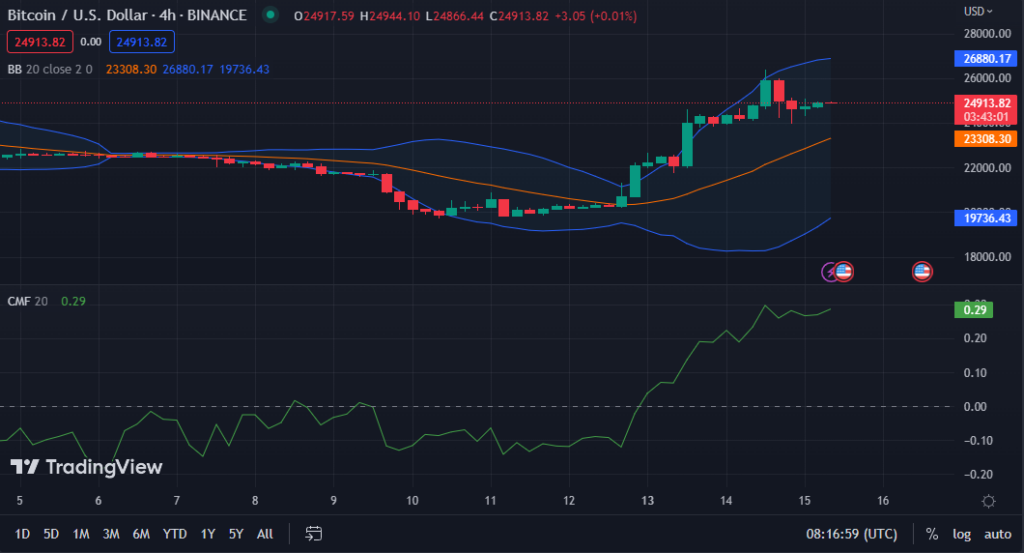
The BTC/USD 2-hour price chart shows promising signs of bullishness, with the Bollinger bands expanding and moving upwards. This suggests that the current trend will likely continue, with the upper band acting as a resistance level. To manage risk, traders may consider buying in the middle band during dips and placing stops below it. The upper band is currently hovering around $26881.41, while the lower band is at $19736.90, indicating a positive outlook. Overall, this analysis highlights the importance of strategic risk management in navigating the volatile cryptocurrency market.
The upward movement of the price action towards the upper band indicates robust buying momentum, suggesting a potential continuation of the market’s upward trend in the short term. Nevertheless, traders must remain vigilant and monitor any possible resistance levels that could trigger a price reversal.
When the Chaikin Money Flow (CMF) reaches a level of 0.29, it is a promising indicator for the Bitcoin market. This is due to the heightened purchasing pressure accompanying a positive and upward-trending CMF, which signifies a growing asset accumulation. Such a trend suggests buyers are willing to pay higher prices to acquire Bitcoin, potentially leading to a surge in its value shortly. As such, investors and traders may view this as an opportune time to enter the market or increase their holdings.

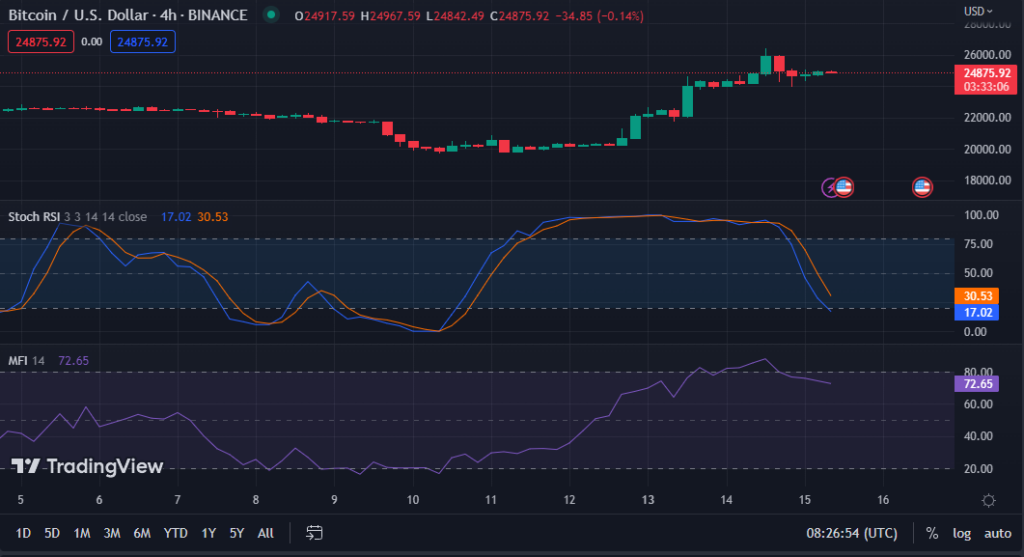
Despite the bullish trend of BTC, the stochastic RSI currently registers at 18.26 and is positioned below its signal line, signaling an oversold market. This observation suggests BTC may experience a short-term price correction before continuing its upward trajectory.
As prudent traders, it is imperative to exercise caution and patience in establishing long positions. A word of caution, the market may experience a temporary downturn; hence it is advisable to wait for confirmation of a trend reversal before taking any action.
The Money Flow Index (MFI) registers a southward movement at 72.60, indicating a potential waning of positive momentum. This development signals a possible emergence of a negative trend, urging traders to exercise prudence and await further indications before making any moves.
The current MFI trend indicates a capital exodus from the market, potentially signaling a shift in investor sentiment toward divestment rather than acquisition.

The upward trend of Bitcoin persists; however, it is prudent for traders to remain vigilant of resistance thresholds and potential price adjustments before initiating long positions.


