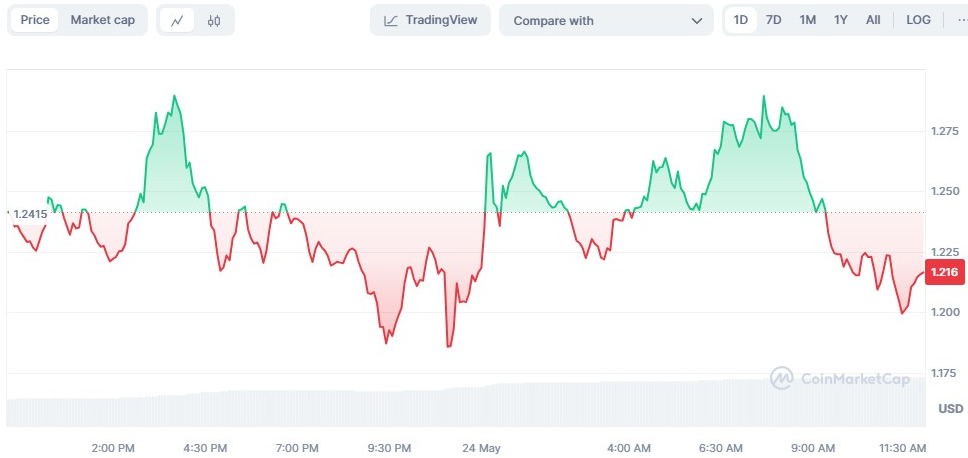
- Starknet’s token price fluctuates, hitting a daily high of $1.29 and low of $1.18.
- Starknet awards $1 million in tokens to Ethereum co-founder Vitalik Buterin.
- Starknet introduces Kakarot zkEVM, aiming to attract more Solidity developers.
The price of Starknet

At the same time, even though there was a tactical decision to assign a grant of $1 million in non-liquid Starknet tokens to Vitalik Buterin, who co-founded Ethereum, the price of Starknet’s token still went through significant variations in the market.
The award, designed to recognize Buterin’s impact and work in the realm of blockchain, was anticipated to enhance investor trust in Starknet. Nonetheless, Starknet’s own cryptocurrency’s value declined soon after the news, defying expectations.
Technological Progress and Economic Forecast
Adding to the interest of the blockchain sector, Starknet disclosed its progress in Ethereum’s layer-2 technologies by unveiling a zero-knowledge rollup that is compatible with Ethereum’s system. This technology, referred to as a zkEVM and named Kakarot, is presently in a phase where it is only accessible to a select group of developers for testing new updates before its broader release. Starknet’s choice to implement a zkEVM is intended to simplify its platform for developers proficient in Solidity, the main coding language used for Ethereum.
The strategic decision to transition from Cairo, a robust yet less widely used programming language, to integrating Solidity via the zkEVM aims to draw a larger pool of developers into the Starknet community. Eli Ben-Sasson, the CEO of StarkWare, has highlighted this shift as a pivotal moment in Starknet’s evolution and advancement.
The launch of the Kakarot zkEVM promises to boost developer involvement with Starknet. In addition, StarkWare has revealed plans to introduce a novel cryptographic prover, dubbed “Stwo,” which is anticipated to significantly enhance the network’s security and performance.
STRK/USD Technical Analysis
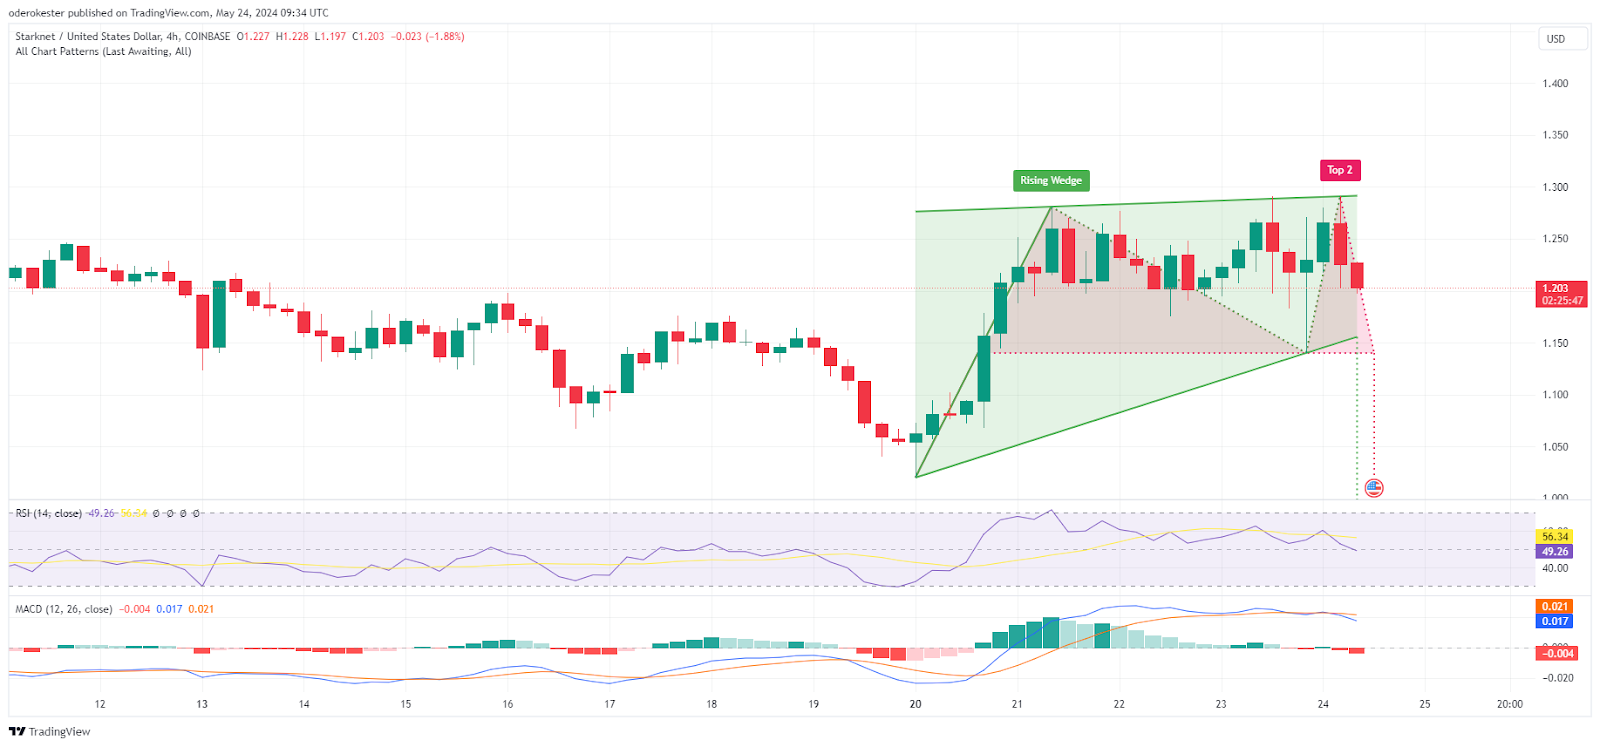
Examining the 4-hour trading chart for STRK/USD, one can observe the formation of a rising wedge pattern characterized by converging trend lines. Within this tightening space, the price exhibits a series of higher highs and higher lows, a configuration often regarded as a bearish indicator due to its suggestion of diminishing bullish momentum. This pattern indicates that a downward breakout from the wedge’s lower edge may be on the horizon if the price continues to fall.
Before the recent price decline, key resistance levels were noted at approximately $1.28 and $1.25. Following the breakout, the immediate support level is found near $1.20. If the price were to fall through this level, it might aim for the subsequent major support zone around $1.15.

The Relative Strength Index (RSI), positioned at approximately 49.72, corresponds with this perspective, indicating a neutral trend with a slight inclination towards bearishness as it moves down from elevated levels. Moreover, the Moving Average Convergence Divergence (MACD) indicates that the MACD line is nearly converging with the signal line and has a marginally negative value, which suggests a potential bearish outlook.
Disclaimer: The insights, perspectives, and data presented in this price analysis are published in good faith. Readers must conduct their own research due diligence. Any decision made by the reader is solely their responsibility, and Crypto Outlooks shall not be held responsible for any consequential or incidental harm or loss.


