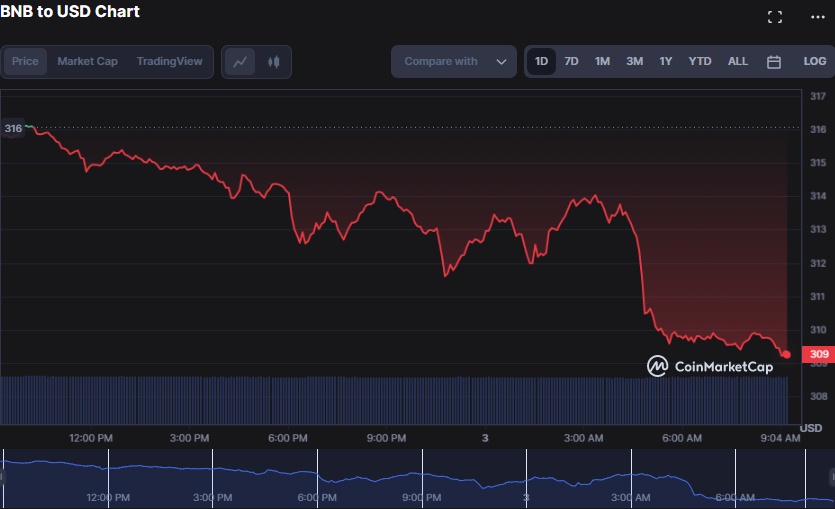
The BNB market witnessed an early takeover by the bears, causing a sharp decline in prices from an intraday high of $316.16, where resistance was encountered, to a low of $309.22. The current $309.23 reflects a 2.18% drop, indicating the bears’ dominance in the market. The possibility of a bullish comeback and a subsequent price surge remains uncertain.
If BNB experiences a dip below the $309.22 mark, it would be wise to watch the subsequent support levels of $305.50 and $301.80. Conversely, if buyers can drive the price upwards beyond $316.16, the next noteworthy resistance levels to note would be $320.50 and $325.80. As always, it is important to remain vigilant and informed when navigating the market’s ever-changing landscape.
Amidst the economic downturn, the BNB market experienced a slight dip, with a 1.55% decrease in 24-hour trading volume and a 2.17% decrease in market capitalization, bringing the figures to $447,589,374 and $48,827,034,579, respectively. This temporary correction warrants a cautious approach from investors, who should closely monitor the price fluctuations to determine the optimal time to move.

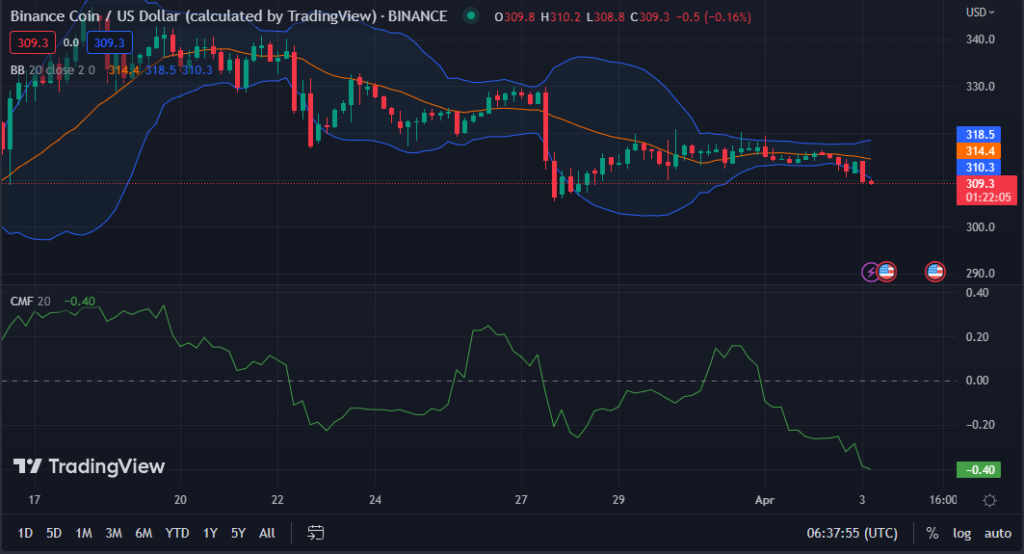
The BNB 4-hour chart reveals a noteworthy development as the Bollinger bands expand, signaling an uptick in selling pressure. This suggests that the price may experience a further decline in the coming days.
The current market trend is evident as the upper bar sits at $318.5 and the lower bar at $310.3. The price action below the lower band suggests an oversold market, potentially leading to a short-term rebound towards the middle band at approximately $314. This analysis highlights the importance of monitoring market trends and utilizing technical indicators to make informed investment decisions.
According to the Chaikin Money Flow indicator, the BNB market is experiencing greater selling pressure than buying pressure, with a southward trend and a reading of -0.40. This suggests that investors are currently reluctant towards BNB and may continue to divest their holdings, potentially resulting in further price drops in the immediate future.

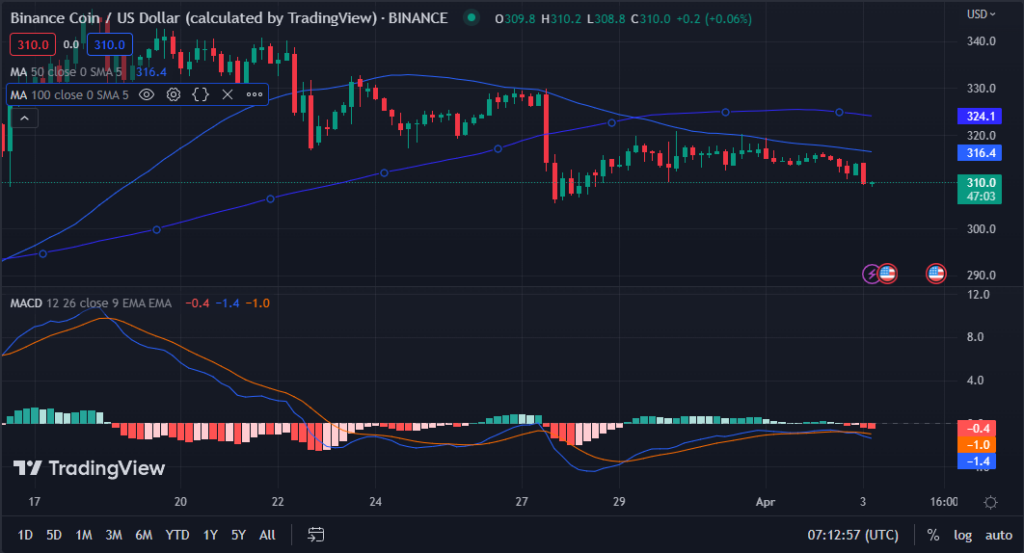
The emergence of the long-term moving average crossing over the short-term moving average indicates that the bearish trend of BNB is reversing. This development presents a promising buying opportunity for traders keen on capitalizing on the market shift.
The current market movement suggests that savvy traders who invest in BNB at this time could potentially reap the rewards of a promising upswing shortly. It’s worth noting that the 100-day moving average currently sits at $324.1, with the 50-day moving average at $316.4. These figures are valuable indicators for those looking to make informed investment decisions.
As the price action dips below both the 100 and 50-day moving averages, there are indications that the downward trend may have reached its lowest point. The bulls are now making strides and gaining momentum.
As the MACD blue line descends beneath its signal line and plunges into negative terrain, registering at -1.4, the BNB rebound could encounter some obstacles. Nevertheless, the broader outlook remains promising, and astute investors may want to contemplate incorporating BNB into their investment portfolios to capitalize on potential profits in the forthcoming weeks.

To summarize, the recent short-term correction of BNB offers a promising chance to buy, yet it’s crucial to exercise prudence as the market is still under the control of bears.
Disclaimer: The insights, perspectives, and data presented in this price analysis are published in good faith. Readers must conduct their own research due diligence. Any decision made by the reader is solely their responsibility, and Crypto Outlooks shall not be held responsible for any consequential or incidental harm or loss.


