- EGRAG CRYPTO sees bullish pattern for Ripple (XRP) on weekly chart.
- XRP’s price hovers at $0.6128, despite a weekly decline of -1.88%.
- Technical indicators suggest short-term bearish trend for XRP with potential further decline.
In a recent post on X (previously known as Twitter), EGRAG CRYPTO, a cryptocurrency analyst and trader, disclosed that Ripple
Although the altcoin is presently testing support levels again, the update from EGRAG CRYPTO indicated that if the favorable trend persists, the digital currency might rise to over $0.70. Observing the past day’s performance, XRP achieved a gain of 1.73% in that timeframe.
Consequently, at the time of reporting, the altcoin’s trading price was $0.6128, as listed on CoinMarketCap. Despite the price rise during the previous trading day, it was insufficient to turn the altcoin’s weekly results positive, as it still showed a decline of -1.88%.

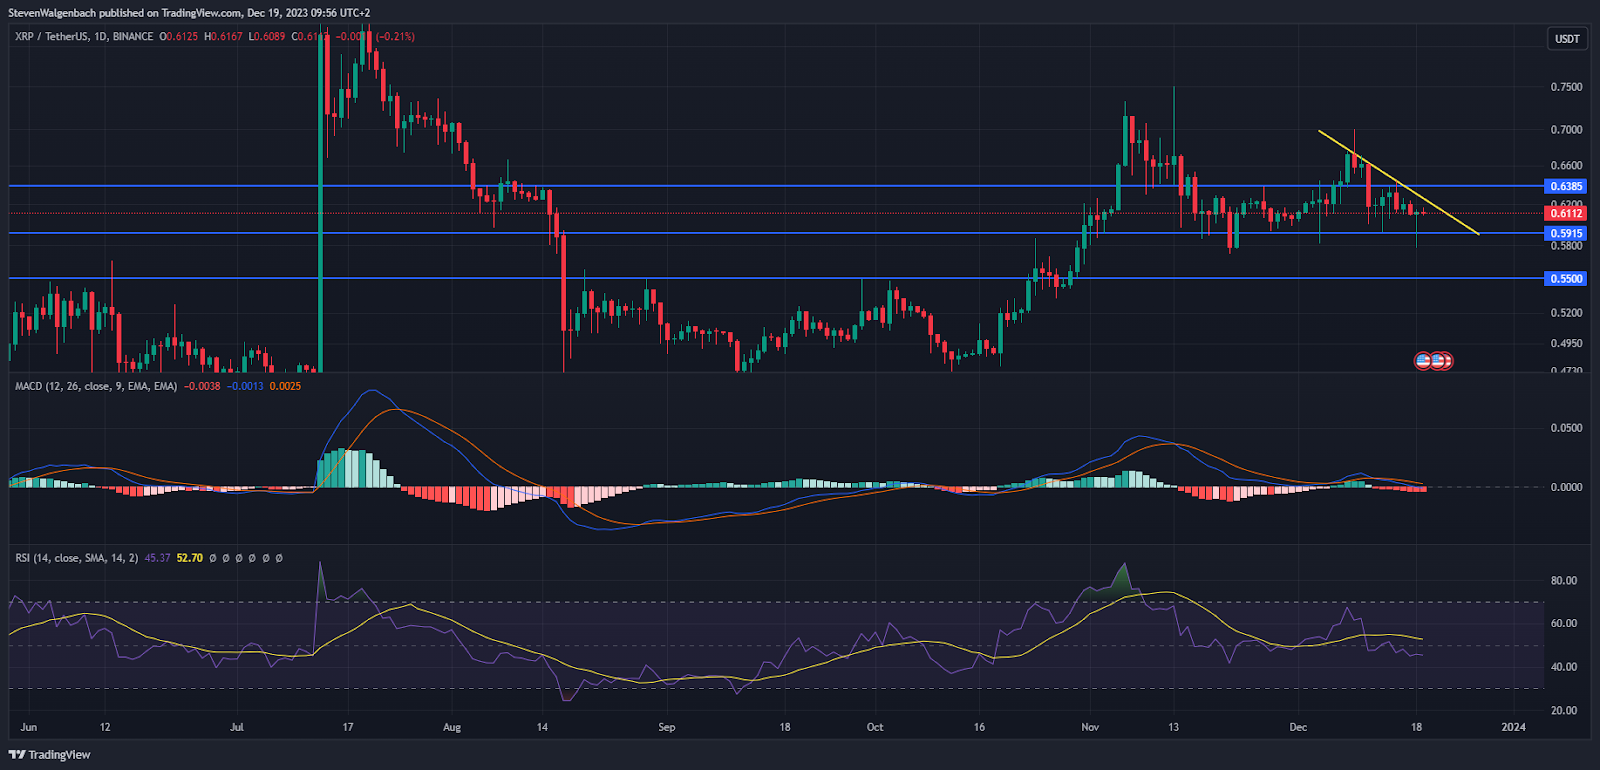
Looking at the immediate technical analysis, XRP’s daily chart exhibits a descending triangle pattern that is typically considered bearish. If this pattern is confirmed, it’s possible that the cryptocurrency could drop beneath the pattern’s support level, which is currently at $0.5915, within the coming days. Should a daily candlestick close under this level, XRP might be vulnerable to a further decline towards $0.55 shortly.
If XRP manages to exit the triangular chart formation within the next 48 hours, the negative outlook could be disproven. Under these more optimistic circumstances, the remittance token might try to convert the resistance level at $0.6385 into a support level.
Technical indicators for XRP on the daily chart indicate a short-term bearish trend. The Moving Average Convergence Divergence (MACD) and the Relative Strength Index (RSI) both point to a growing bearish momentum.
The MACD line diverged downward from the MACD Signal line, intensifying the bearish trend. Concurrently, at the time of reporting, the RSI line was beneath the RSI Simple Moving Average (SMA) line. This typically suggests that the bearish momentum is overpowering the bullish momentum.
Disclaimer: The insights, perspectives, and data presented in this price analysis are published in good faith. Readers must conduct their own research due diligence. Any decision made by the reader is solely their responsibility, and Crypto Outlooks shall not be held responsible for any consequential or incidental harm or loss.


