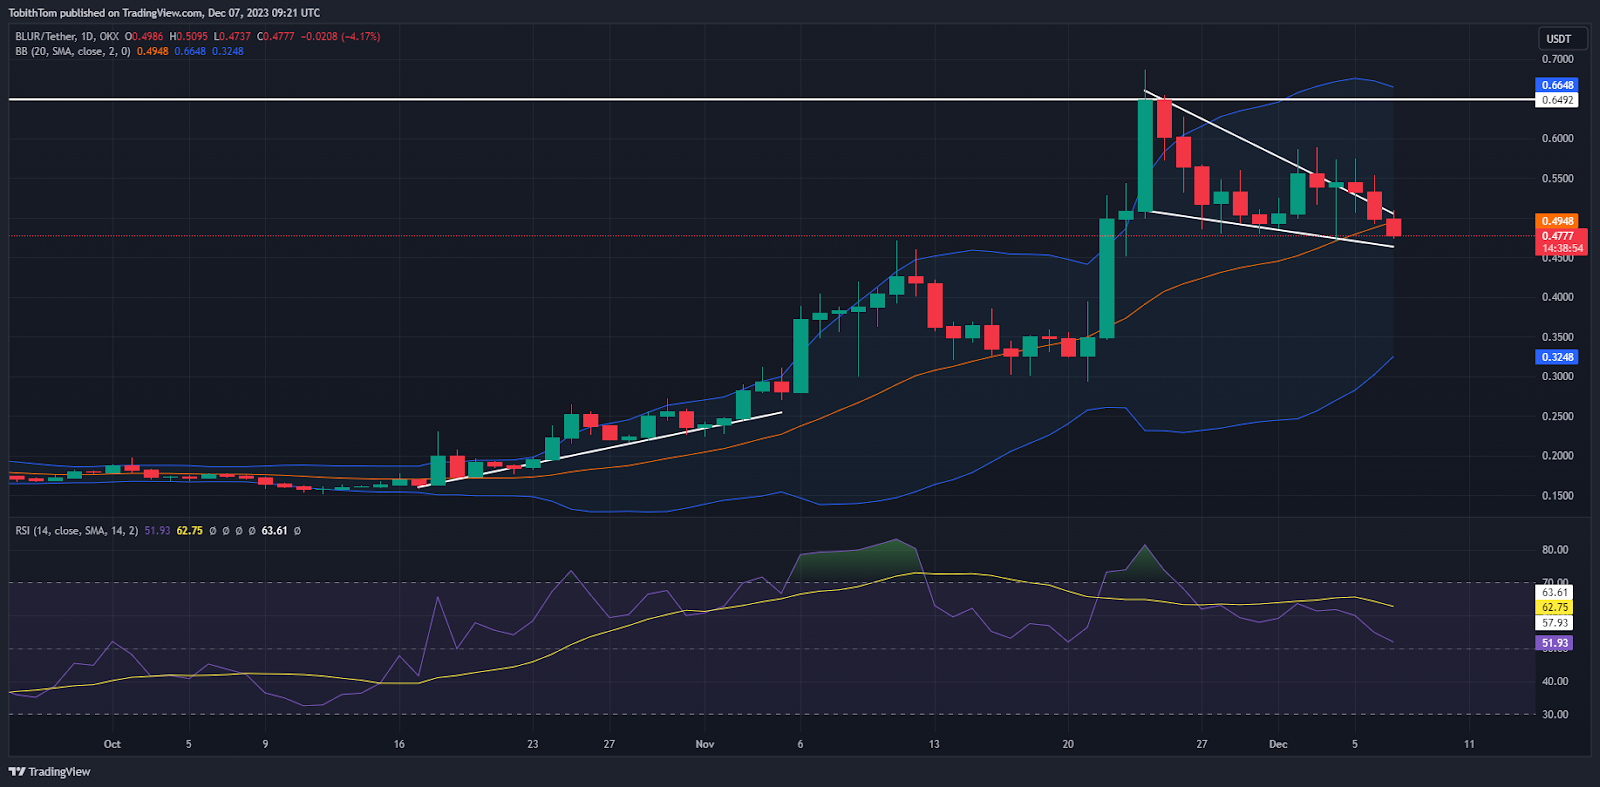
- BLUR token price drops 7.05% to a daily low of $0.4851.
- BLUR’s trading volume falls by 39.40%, signaling reduced investor interest.
- Large holders sell off 16.5 million BLUR, impacting market sentiment.
Today, as analysts and traders began their day on the trading floor, they observed a notable decrease in the price of BLUR
BLUR, priced at $0.4845, persists in its downward trajectory despite a short-lived effort to break free from the current downtrend. Additionally, the 39.40% decline in BLUR’s trading volume may suggest a change in the outlook of investors and a reduction in trading momentum.
The on-chain market analysis platform Lookonchain observed significant sell-offs by large-scale holders and big financial players, amounting to 16.5 million BLUR tokens. The platform pointed out that a major investor transferred 2.54 million BLUR, which they had received through an airdrop, to the Binance exchange. When this was reported, the value of the 2.54 million BLUR was calculated to be approximately $1.26 million.
Additionally, Mandala Capital transferred 2.76 million BLUR tokens to the OKX exchange and incurred a loss of around $100,000 in the process. A different large-scale investor, known by the identifier “0x68b5,” moved 3.31 million BLUR out of Binance over the period from November 25 to November 29. This investor then sent the tokens back to Binance within the subsequent two days, resulting in a financial setback of about $65,000.
Coinbase Custody transferred BLUR to five wallets, which then moved a combined amount of 8.24 million BLUR, worth around $4.12 million, to exchanges via Wintermute. This large-scale whale selling could have tipped the market balance to favor the bears over the bulls.

Observing the chart presented, it appears that the candlesticks could be forming a descending wedge pattern within an upward trend. The significant green candlestick followed by smaller red candlesticks correcting the price are among analysts’ frequently noted patterns.
Nonetheless, it remains premature to ascertain the occurrence of a descending wedge or determine if the breakout will be upward or downward. Given that the prior ascending trend was significantly driven by purchasing activity, as evidenced by the RSI indicator, it is possible that the candlesticks might persist in a downward trajectory for a duration.
Disclaimer: The insights, perspectives, and data presented in this price analysis are published in good faith. Readers must conduct their own research due diligence. Any decision made by the reader is solely their responsibility, and Crypto Outlooks shall not be held responsible for any consequential or incidental harm or loss.


