Crypto Outlooks
  • Bitcoin
  • Ethereum
  • Altcoins
  • Price Analysis
  • Exchanges
  • NFT
  • DeFi
  • Glossary
No Result
View All Result
Crypto Outlooks
No Result
View All Result
Home Price Analysis

GRT might see a short-term reversal, even with bullish on-chain indicators

Gary Flanders by Gary Flanders
2 years ago
GRT might see a short-term reversal, even with bullish on-chain indicators
  • The Graph (GRT) has seen a 100% increase in value since October 2023.
  • Santiment reports significant activity from large-scale investors in the altcoin market.
  • Technical indicators suggest a higher probability of a bearish trend for GRT.

The Graph has seen almost a 100% increase in its value since October 19, 2023, and it is predicted to maintain this upward trend, as per the data from the blockchain analytics firm Santiment. In a recent post, Santiment highlighted that there has been significant activity from large-scale investors, or “whales”, in the altcoin market, with a noticeable increase in the creation of new on-chain addresses.

📊 #TheGraph has nearly doubled since October 19th, and there has been major whale movement and new addresses being created. To identify whether a #bullish trend can continue, the mean dollar age line moving down (like it has for $GRT) is often validation. https://t.co/mJZiZitJ9P pic.twitter.com/q0Dzp3dsPd

— Santiment (@santimentfeed) November 8, 2023

Santiment has disclosed that the mean dollar average for GRT is on a downward trajectory. This indicates that the bullish trend of the cryptocurrency could persist in the near term.

Related

Trump Backs Crypto at Bitcoin Conf; Ethereum Eyes $4454 in 2024

Shiba Inu (SHIB) Shows Resilience Amid Market Volatility

On-chain data analysis reveals that The Graph has experienced its peak whale activity since February of the current year. Per the post by Santiment, 149 individual transactions on the project’s network surpassed a value of $100K. Concurrently, the network saw the creation of 620 new addresses.

Despite the robust on-chain metrics, CoinMarketCap reported a 24-hour loss exceeding 5% for GRT. As a result, the altcoin was exchanging at $0.131 at the time of reporting. However, GRT’s weekly performance was still firmly in the positive territory, showing a gain of +25%.
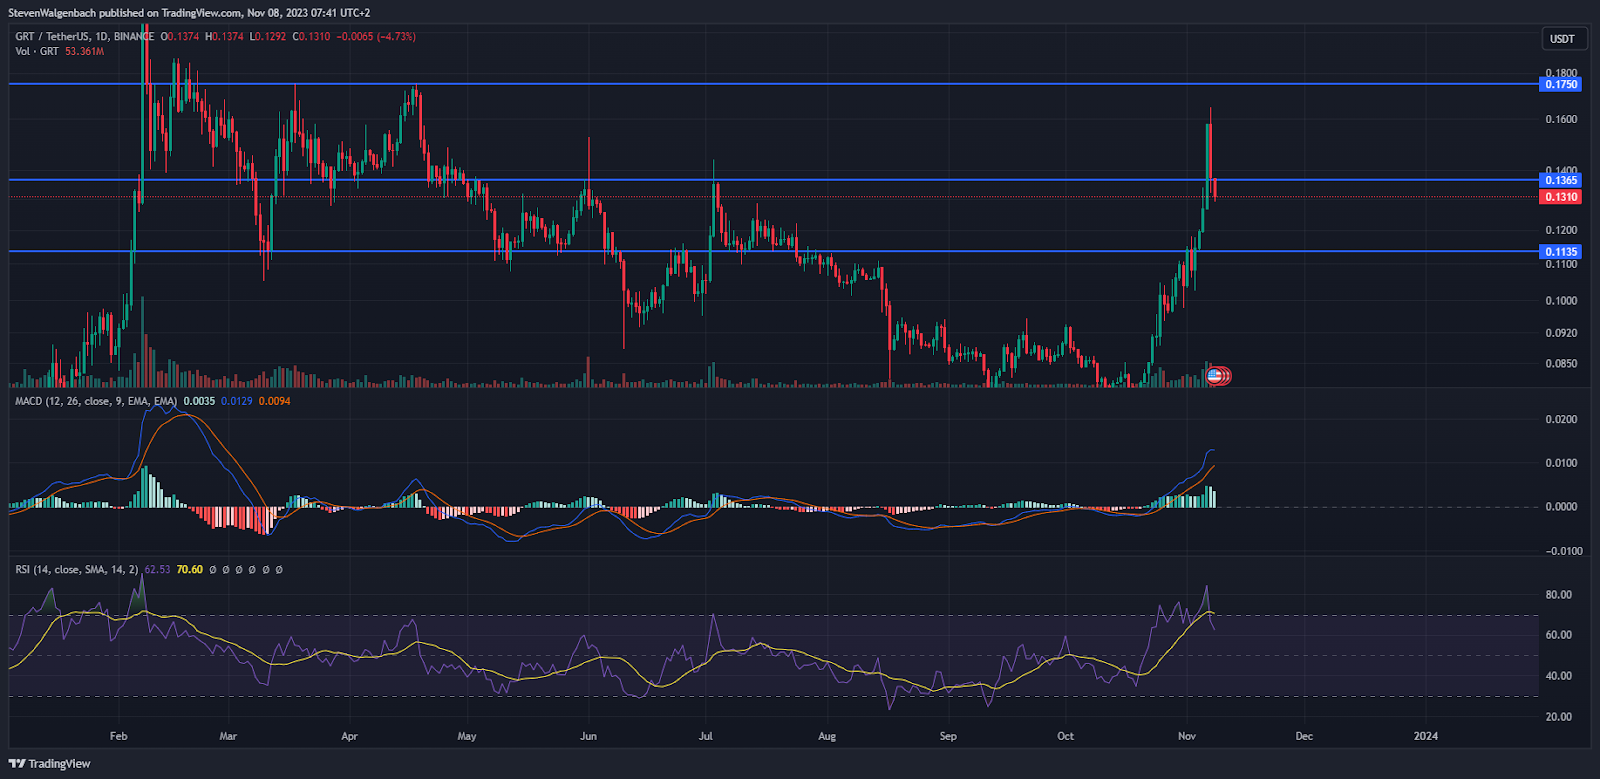
Daily chart for GRT/USDT
Daily chart for GRT/USDT (Source: TradingView)

Over the last 24 hours, the price of GRT has fallen beneath the crucial support level of $0.1365. If the cryptocurrency ends today’s daily trading below this threshold, it could face a downward correction to the $0.1135 support level in the coming days. On the other hand, if it closes above $0.1365 today, GRT could rise to $0.1750 within the next week.

Based on technical indicators, there is a higher probability of a bearish trend shortly. As of the latest update, the daily Moving Average Convergence Divergence (MACD) line is nearing the MACD Signal line. This could indicate an impending bearish trend reversal for GRT.

In the meantime, the daily Relative Strength Index (RSI) line has moved below the RSI Simple Moving Average (SMA) line in a bearish crossover within the last 48 hours. This indicates that sellers have taken a dominant position over buyers in the GRT market, which could potentially result in a further decline in GRT’s price over the next 24-48 hours.

Disclaimer: The insights, perspectives, and data presented in this price analysis are published in good faith. Readers must conduct their own research due diligence. Any decision made by the reader is solely their responsibility, and Crypto Outlooks shall not be held responsible for any consequential or incidental harm or loss.

Tags: GraphGRTPrice AnalysisSantiment
TweetShareShare
Gary Flanders

Gary Flanders

Passionate writer who is keenly exploring crypto and Blockchain loves to know about new things and explore what is happening in the world. Cherishes writing, primarily about cryptocurrency and Blockchain.

Read also

Trump Backs Crypto at Bitcoin Conf; Ethereum Eyes $4454 in 2024
Ethereum

Trump Backs Crypto at Bitcoin Conf; Ethereum Eyes $4454 in 2024

by Ian Pittman
10 months ago
Shiba Inu (SHIB) Shows Resilience Amid Market Volatility
Price Analysis

Shiba Inu (SHIB) Shows Resilience Amid Market Volatility

by Gary Flanders
11 months ago
Ethereum Price Soars 17% as SEC Signals Potential ETF Approval
Ethereum

Ethereum Price Soars 17% as SEC Signals Potential ETF Approval

by Ian Pittman
12 months ago
Bitcoin Surges Past $66K, Eyes $70K Amid Bullish Market
Bitcoin

Bitcoin Surges Past $66K, Eyes $70K Amid Bullish Market

by Gary Flanders
1 year ago
Ethereum Whale Moves $12.2M to Coinbase, Eyes Bullish Market
Price Analysis

Ethereum Whale Moves $12.2M to Coinbase, Eyes Bullish Market

by Gary Flanders
1 year ago
Crypto Outlooks

Get insights on market trends, new developments, and expert analysis to help you make informed investment decisions.

Browse by Category

  • Altcoins
  • Bitcoin
  • DeFi
  • Ethereum
  • Exchanges
  • NFT
  • Price Analysis

Get Instant Notifications

Subscribe to our mailing list to receives latest updates direct to your inbox!

*we hate spam as much as you do

  • Glossary
  • Privacy Policy
  • Get in Touch

© 2025 CryptoOutlooks.com

No Result
View All Result
  • Bitcoin
  • Ethereum
  • Altcoins
  • Price Analysis
  • Exchanges
  • NFT
  • DeFi
  • Glossary

© 2025 CryptoOutlooks.com