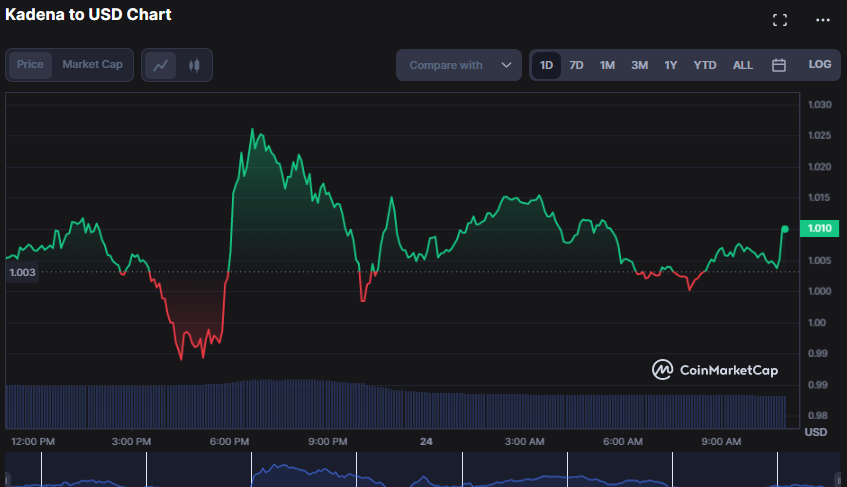
Over the past 24 hours, the Kadena (KDA) market has been primarily influenced by bullish activity, despite bearish efforts. However, KDA did experience a dip to a 24-hour low of $0.9888.
Despite bearish attempts, the bullish strength prevailed, propelling the KDA price to a remarkable $1.03. However, resistance was encountered shortly after. As of press time, KDA is trading at $1.01, indicating a 0.32% increase from the previous day’s close.
Should the bulls continue to dominate and successfully surpass the 24-hour high, we may encounter resistance levels at $1.05 and $1.10. However, a sudden shift in market sentiment could trigger a price retreat toward the support levels at $0.98 and $0.95.
In the ongoing tussle between the bullish and bearish forces, the market capitalization has witnessed a commendable surge of 1.22%, reaching a whopping $225,636,799. This remarkable feat is a testament to the investors’ keen eye for price fluctuations and ability to capitalize on the market’s volatility.
The recent 23.30% decrease in 24-hour trading volume, which now stands at $5,124,285, suggests that investors exercise greater prudence and patience before engaging in further transactions. This shift in behavior may indicate a change in market sentiment as investors await clearer signals before making any significant moves.

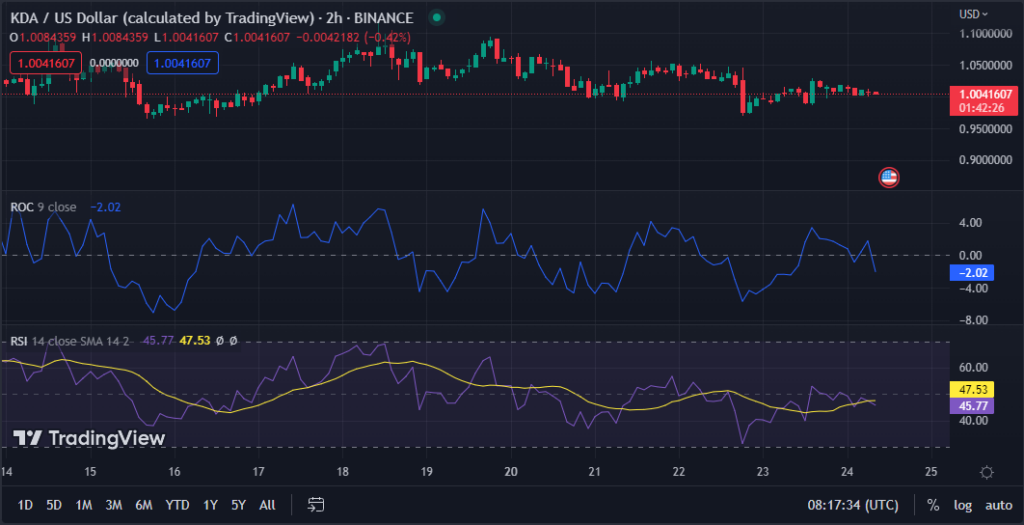
The KDA 2-hour price chart’s Relative Strength Index (RSI) has recently experienced a bearish crossing, with a value of -2.02, as it fell below its signal line. This development indicates that the current bullish trend may be losing momentum and that a potential trend reversal could be on the horizon. As such, investors must remain vigilant and consider adjusting their strategies accordingly.
The occurrence of an RSI bearish crossing indicates that the market is experiencing a decline in buying pressure while selling pressure is on the rise. This shift in market dynamics is a strong signal that the overall sentiment will likely turn unfavorable.
Further exacerbating the somber outlook, the Rate of Change has dipped below the critical threshold of zero, plummeting to a disheartening -2.02. This downward ROC trajectory indicates that the asset’s momentum is losing steam, and a potential trend reversal looms.
As this trend continues, traders may interpret it as a clear indication to divest from their long positions or even consider taking short positions in anticipation of a potential price decline.

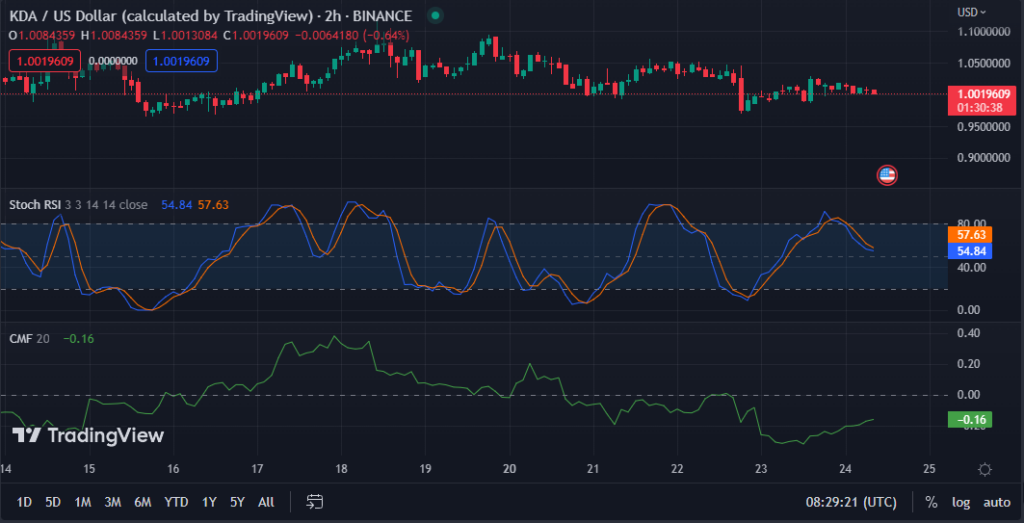
The KDA market’s bullish trend may be experiencing a shift in sentiment as its stochastic RSI value of 56.96 dips below its signal line. This could indicate a potential loss of momentum, prompting traders to watch the market’s next move.
This trend highlights the importance of prudence and monitoring market dynamics before executing any trading decisions. A potential dip in the stochastic RSI level could signal a significant shift towards pessimism, underscoring the need for careful consideration and strategic planning.
The Chaikin Money Flow (CMF) trend has dipped into the negative zone, registering a score of -0.15. This development suggests that the selling pressure is rising, potentially impacting the price further. The CMF pattern indicates that traders are more inclined towards selling than buying, which could lead to a negative market trend.

The KDA market sentiment has taken a bearish turn as indicators point towards a potential trend reversal, indicating that the bears may have the upper hand.
Disclaimer: The insights, perspectives, and data presented in this price analysis are published in good faith. Readers must conduct their own research due diligence. Any decision made by the reader is solely their responsibility, and Crypto Outlooks shall not be held responsible for any consequential or incidental harm or loss.


