- Solana (SOL) recorded a 24-hour increase of 0.16%, trading at $19.87.
- Ripple (XRP) increased by 1.62%, with a trading price of $0.515.
- Galxe (GAL) saw a significant price increase of 6.96%, trading at $1.30.
In the last trading day, Solana
Solana (SOL)
SOL managed to record a 24-hour increase of 0.16%. This upward trend contributed to its weekly performance, elevating the altcoin’s weekly gain to +11.14%. Consequently, due to the recent price fluctuation, the altcoin was trading at $19.87 at the time of reporting.

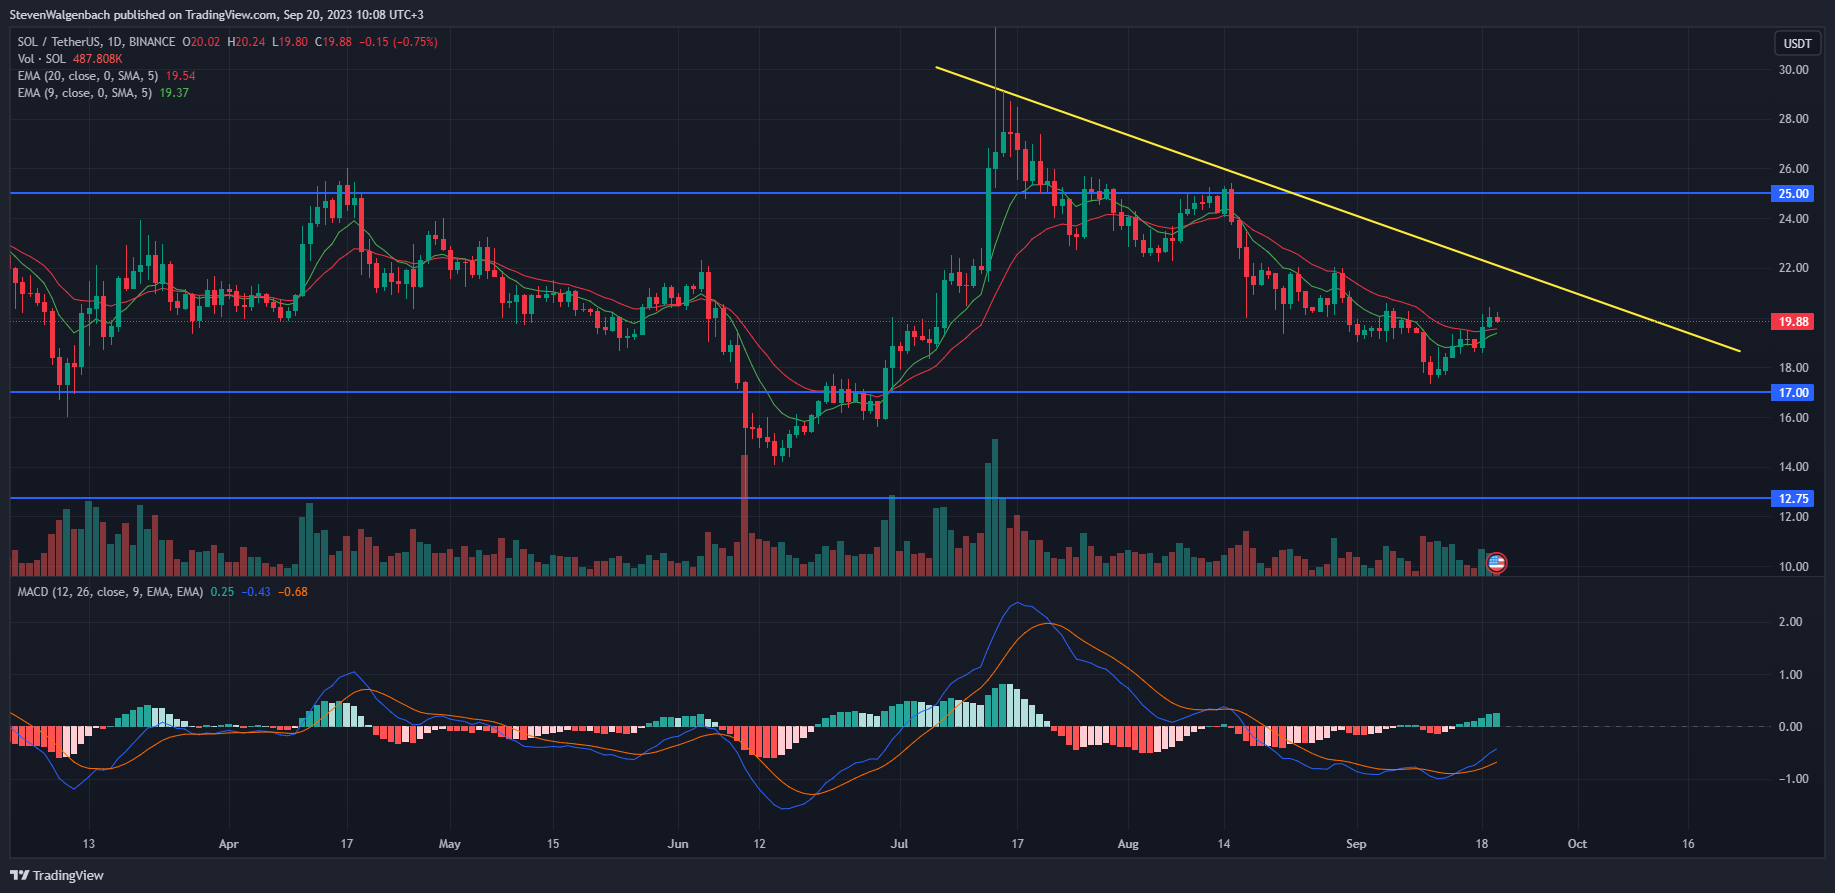
Regarding technical analysis, SOL has surpassed the 9-day and 20-day EMA lines in the last 48 hours and has maintained its position above these two technical markers. If this upward trend persists, SOL could breach the medium-term bearish trend line forming on its daily chart over the recent weeks.
Following this, the altcoin price is expected to have an unobstructed route to increase to the next resistance level at $25. This optimistic prediction will be nullified if the price of SOL closes a daily candlestick below the 9-day EMA line, approximately at $19.37, within the forthcoming 48 hours. Under these circumstances, the price of SOL could decrease to the immediate support level of $17 in the subsequent few days.
Should the selling pressure continue, SOL could fall below its current level and reach $12.75. The likelihood of an upward trend in the next few days is high, considering the multiple bullish indicators observed on the altcoin’s daily chart.
The daily MACD line has consistently surpassed the daily MACD signal line in the past week. This could indicate a recent bullish reversal in SOL’s previously negative trend. Another technical indicator pointing towards a potential rise in SOL’s price in the upcoming days is the daily MACD Histogram, which has steadily increased over the last three days. This implies that the bullish trend could persist.
Furthermore, a notable bullish technical flag was poised to be activated on SOL’s daily chart. As of the latest update, the 9-day EMA line was trying to surpass the 20-day EMA line. Should these two technical indicators intersect, it may indicate a shift in short-term momentum towards the bulls.
Ripple (XRP)
The value of the remittance token increased by 1.62% during the previous trading day. Interestingly, this was the second-largest daily increase among the top 10 cryptocurrencies, placing XRP just behind Toncoin
In the last 24 hours, XRP’s total trading volume has increased. According to data from CoinMarketCap, the daily trading volume of this altcoin rose by 0.34%. Consequently, the cumulative trading volume was slightly above $1.015 billion.

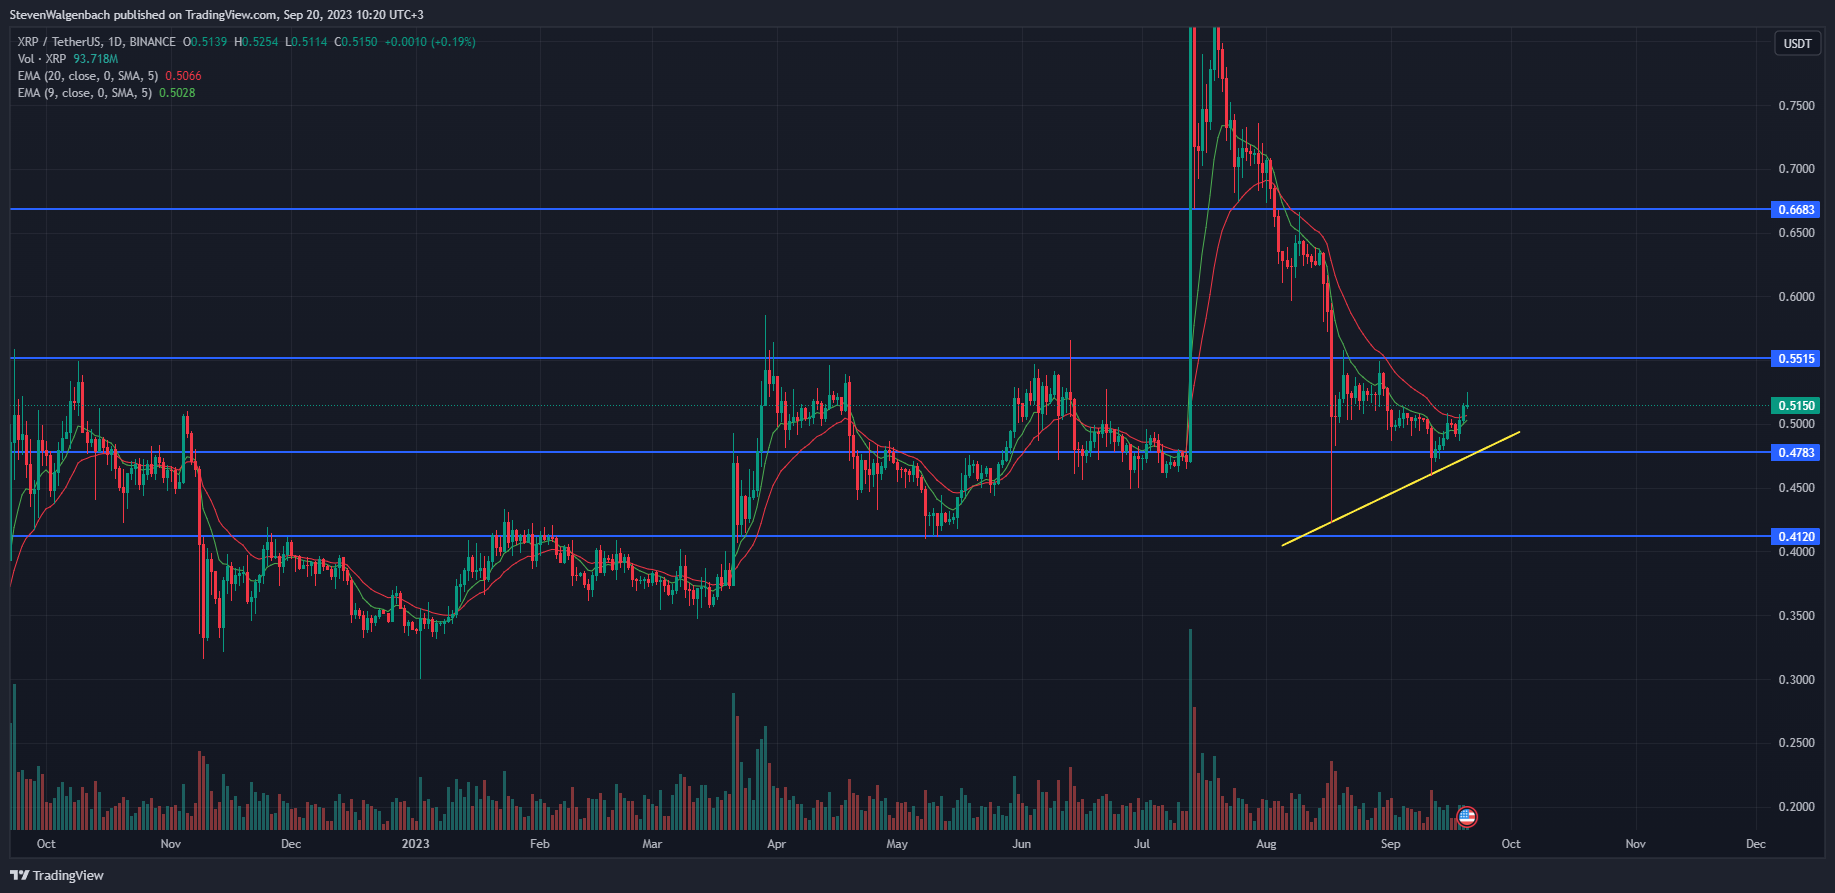
Over the past several weeks, XRP’s daily chart has shown a positive trend line, following the cryptocurrency’s price recording a second higher low during this timeframe. This upward momentum persisted, enabling XRP to surpass the $0.4783 level and the 9-day and 20-day EMA lines, where it remained trading at the time of reporting.
Like SOL, the 9-day EMA line on XRP’s daily chart was poised to cross above the 20-day EMA line. Should these two lines intersect within the forthcoming 24-48 hours, XRP’s price could surpass the resistance level of $0.551. This could also provide the necessary support for the cryptocurrency’s price to aim for $0.6683.
Conversely, if XRP falls below the earlier surpassed price of $0.4783, it will also mean a break below the upward trend line established on its daily chart. As a result, XRP could decline to the next significant support level of $0.4120 in the subsequent week.
Galxe (GAL)
In the last 24 hours, GAL has seen the most significant price increase, with a notable rise of 6.96%. Consequently, the price of GAL is now $1.30, which is nearer to its 24-hour low of $1.21 than its high of $1.41 during the same period. In addition to the substantial price increase, GAL’s trading volume has also experienced a surge of over 400%.

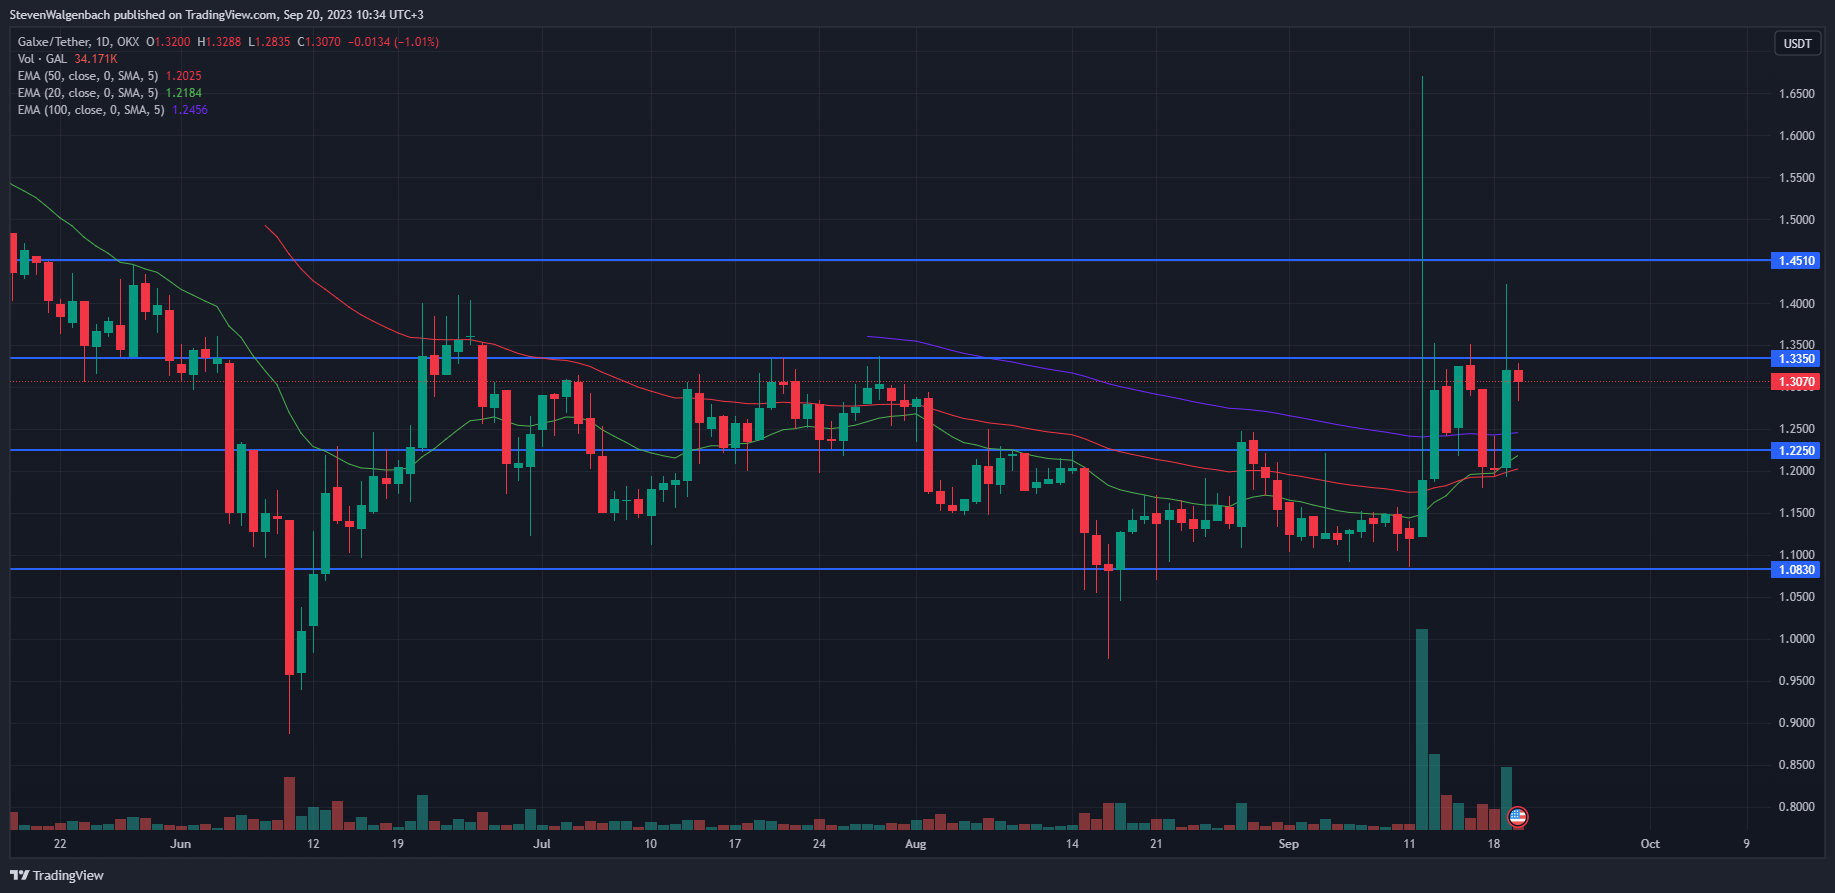
GAL tried to surpass the crucial resistance level of $1.3350 at the reporting time. It exceeded this threshold in the previous day’s trading session, but the sellers responded swiftly, causing GAL to end the trading session below this significant price level.
Technical analysis indicates that GAL could again surpass the $1.3350 mark in the forthcoming 24-48 hours. For example, the 20-day EMA line recently moved above the 50-day EMA line, which indicates that the medium-term momentum is now leaning towards the buyers.
Should the technical flag be confirmed in the next few days, GAL’s price could increase to a maximum of $1.4510 within two weeks. However, if GAL’s price falls below $1.2250 in the next few days, this optimistic prediction will be nullified.
This level aligns with the 50-day EMA line and is approximately the same level as the 9 and 20 EMA lines on GAL’s daily chart. Consequently, a downward breach of this point could trigger a significant price decline to the critical support level of $1.0830.
Disclaimer: The insights, perspectives, and data presented in this price analysis are published in good faith. Readers must conduct their own research due diligence. Any decision made by the reader is solely their responsibility, and Crypto Outlooks shall not be held responsible for any consequential or incidental harm or loss.


