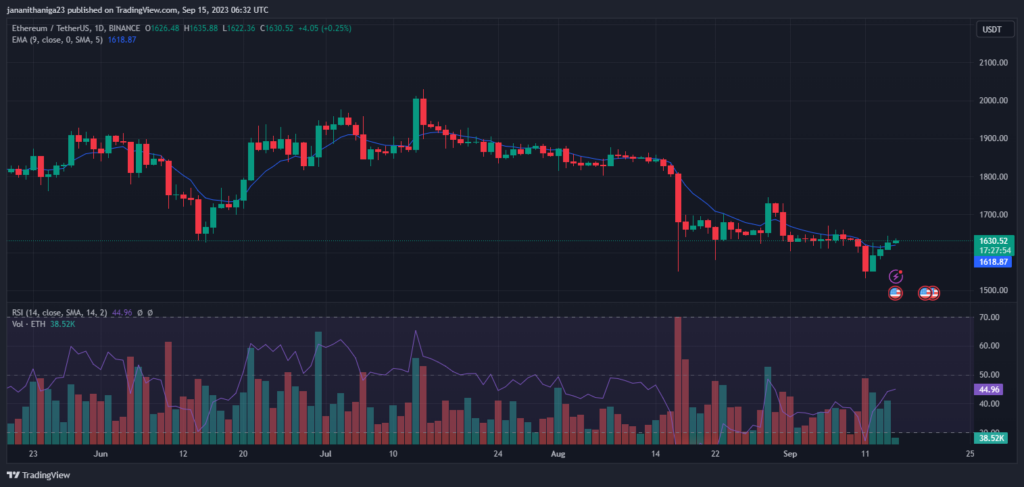
- Ethereum’s bearish trend is slowing, with the ETH graph showing a rising trend.
- Franklin Templeton applied for spot Bitcoin ETFs, potentially influencing the cryptocurrency market.
- Ethereum’s 7-day Moving Average of Active Addresses hit a three-month peak.
Ethereum’s
A contributing factor to this brief pause in the downward trend is the ongoing development of the Bitcoin and Ethereum ETFs, which continue to build momentum. Additionally, mirroring the actions of major players such as Blackrock and ARK Investors, Franklin Templeton applied for spot Bitcoin ETFs two days prior.
Experts propose that these financial behemoths will likely receive regulatory approval due to the rigorous monitoring systems they’ve implemented to avoid market manipulation. The possible sanctioning of these ETFs could undeniably significantly influence the overall cryptocurrency market.
Conversely, the Ethereum network noted 1,089,893 distinct wallets participating in ETH transactions on Wednesday, representing the second-largest figure in the nearly eight-year history of the asset.
Santiment, a leading cryptocurrency data compiler, indicates that the recent unexpected increase in activity could trigger a price recovery. Furthermore, the 7-day Moving Average of Active Addresses for Ethereum recently hit a three-month peak of 30,545.637.
Nonetheless, investors continue to exercise caution due to negative market sentiment, as shown by a 16.08% decrease in trading volume in the last 24 hours. Furthermore, Ethereum is still 66.62% below its highest value, achieved two years prior.
Can the price be driven higher by bulls?
A review of the recent price fluctuations of Ethereum shows a strong tug-of-war between buyers and sellers on the daily chart. The 9-day exponential moving average (EMA) is presently at $1,629, higher than the current trading price, suggesting a continuing bearish outlook. The daily relative strength index (RSI) is at 44, suggesting that the asset is approaching an oversold state.

For the bulls to win, they must push the price beyond the 20-day EMA and then try to rally towards the 50-day SMA at $1,762. This action could enhance the chances of Ethereum being traded within a range of $1,626 to $2,000 in the upcoming period.


