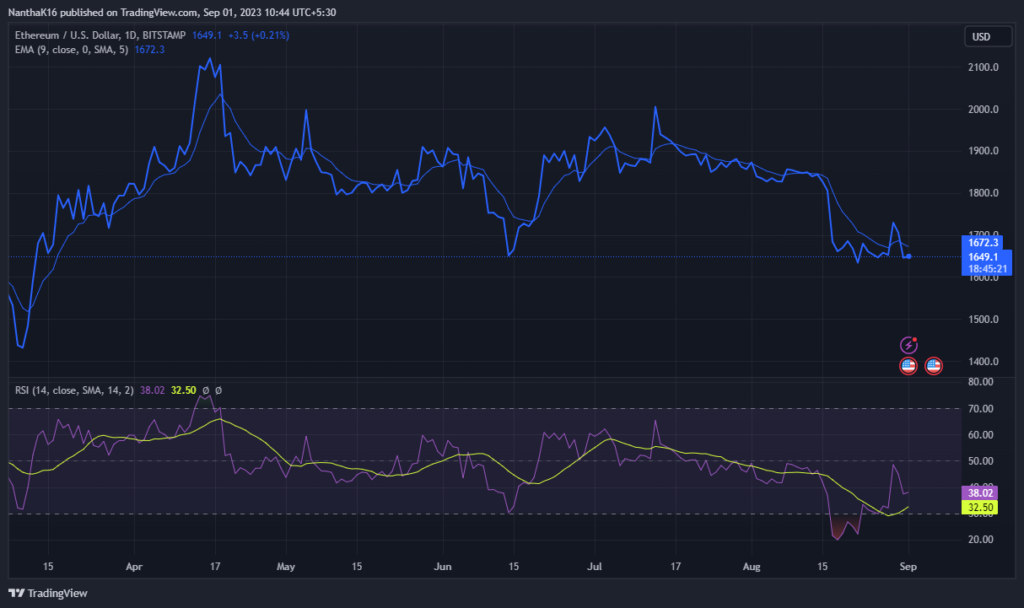
- Ethereum’s price has dipped below $1700, marking a 3% decline.
- Ethereum’s daily trading volume increased by 45.67%, according to CoinMarketCap.
- Ethereum’s current trading price is below the 50-day exponential moving average.
Ethereum
Over the recent weeks, Ethereum has been hovering around the $1600 mark. However, on August 29, the digital currency experienced a sudden bullish run, breaking the $1700 barrier. ETH maintained its upward trajectory for several days, peaking at $1741. Unfortunately, this bullish trend was short-lived. Ethereum has since demonstrated a bearish trend, causing its price to dip below the $1700 threshold.
Ethereum (ETH) Returns to Bearish Trend
As of the latest update, Ethereum is priced at $1,649, reflecting a 3.04% decrease in the past 24 hours. Despite this, there has been a significant increase in ETH’s daily trading volume by 45.67%, as per data from CoinMarketCap.

The latest trading graph indicates a bearish trend for Ethereum, with its current trading price falling below the 50-day exponential moving average (50 EMA), signifying a potential downturn. Concurrently, the daily relative strength index (RSI) stands at 32.50, suggesting that the leading altcoin is teetering on the edge of the oversold territory.
Should the prevailing trend take a U-turn, we could witness a bullish surge in ETH, potentially pushing it further beyond the $1700 threshold. Should this momentum persist, it could break through the $1750 barrier and even exceed the $1800 mark. Conversely, Ethereum could potentially face an extended bearish phase. The price could break through the immediate support level of $1600 in such a scenario. In unfavorable circumstances, this bearish trend could drag it below the $1540 mark.


